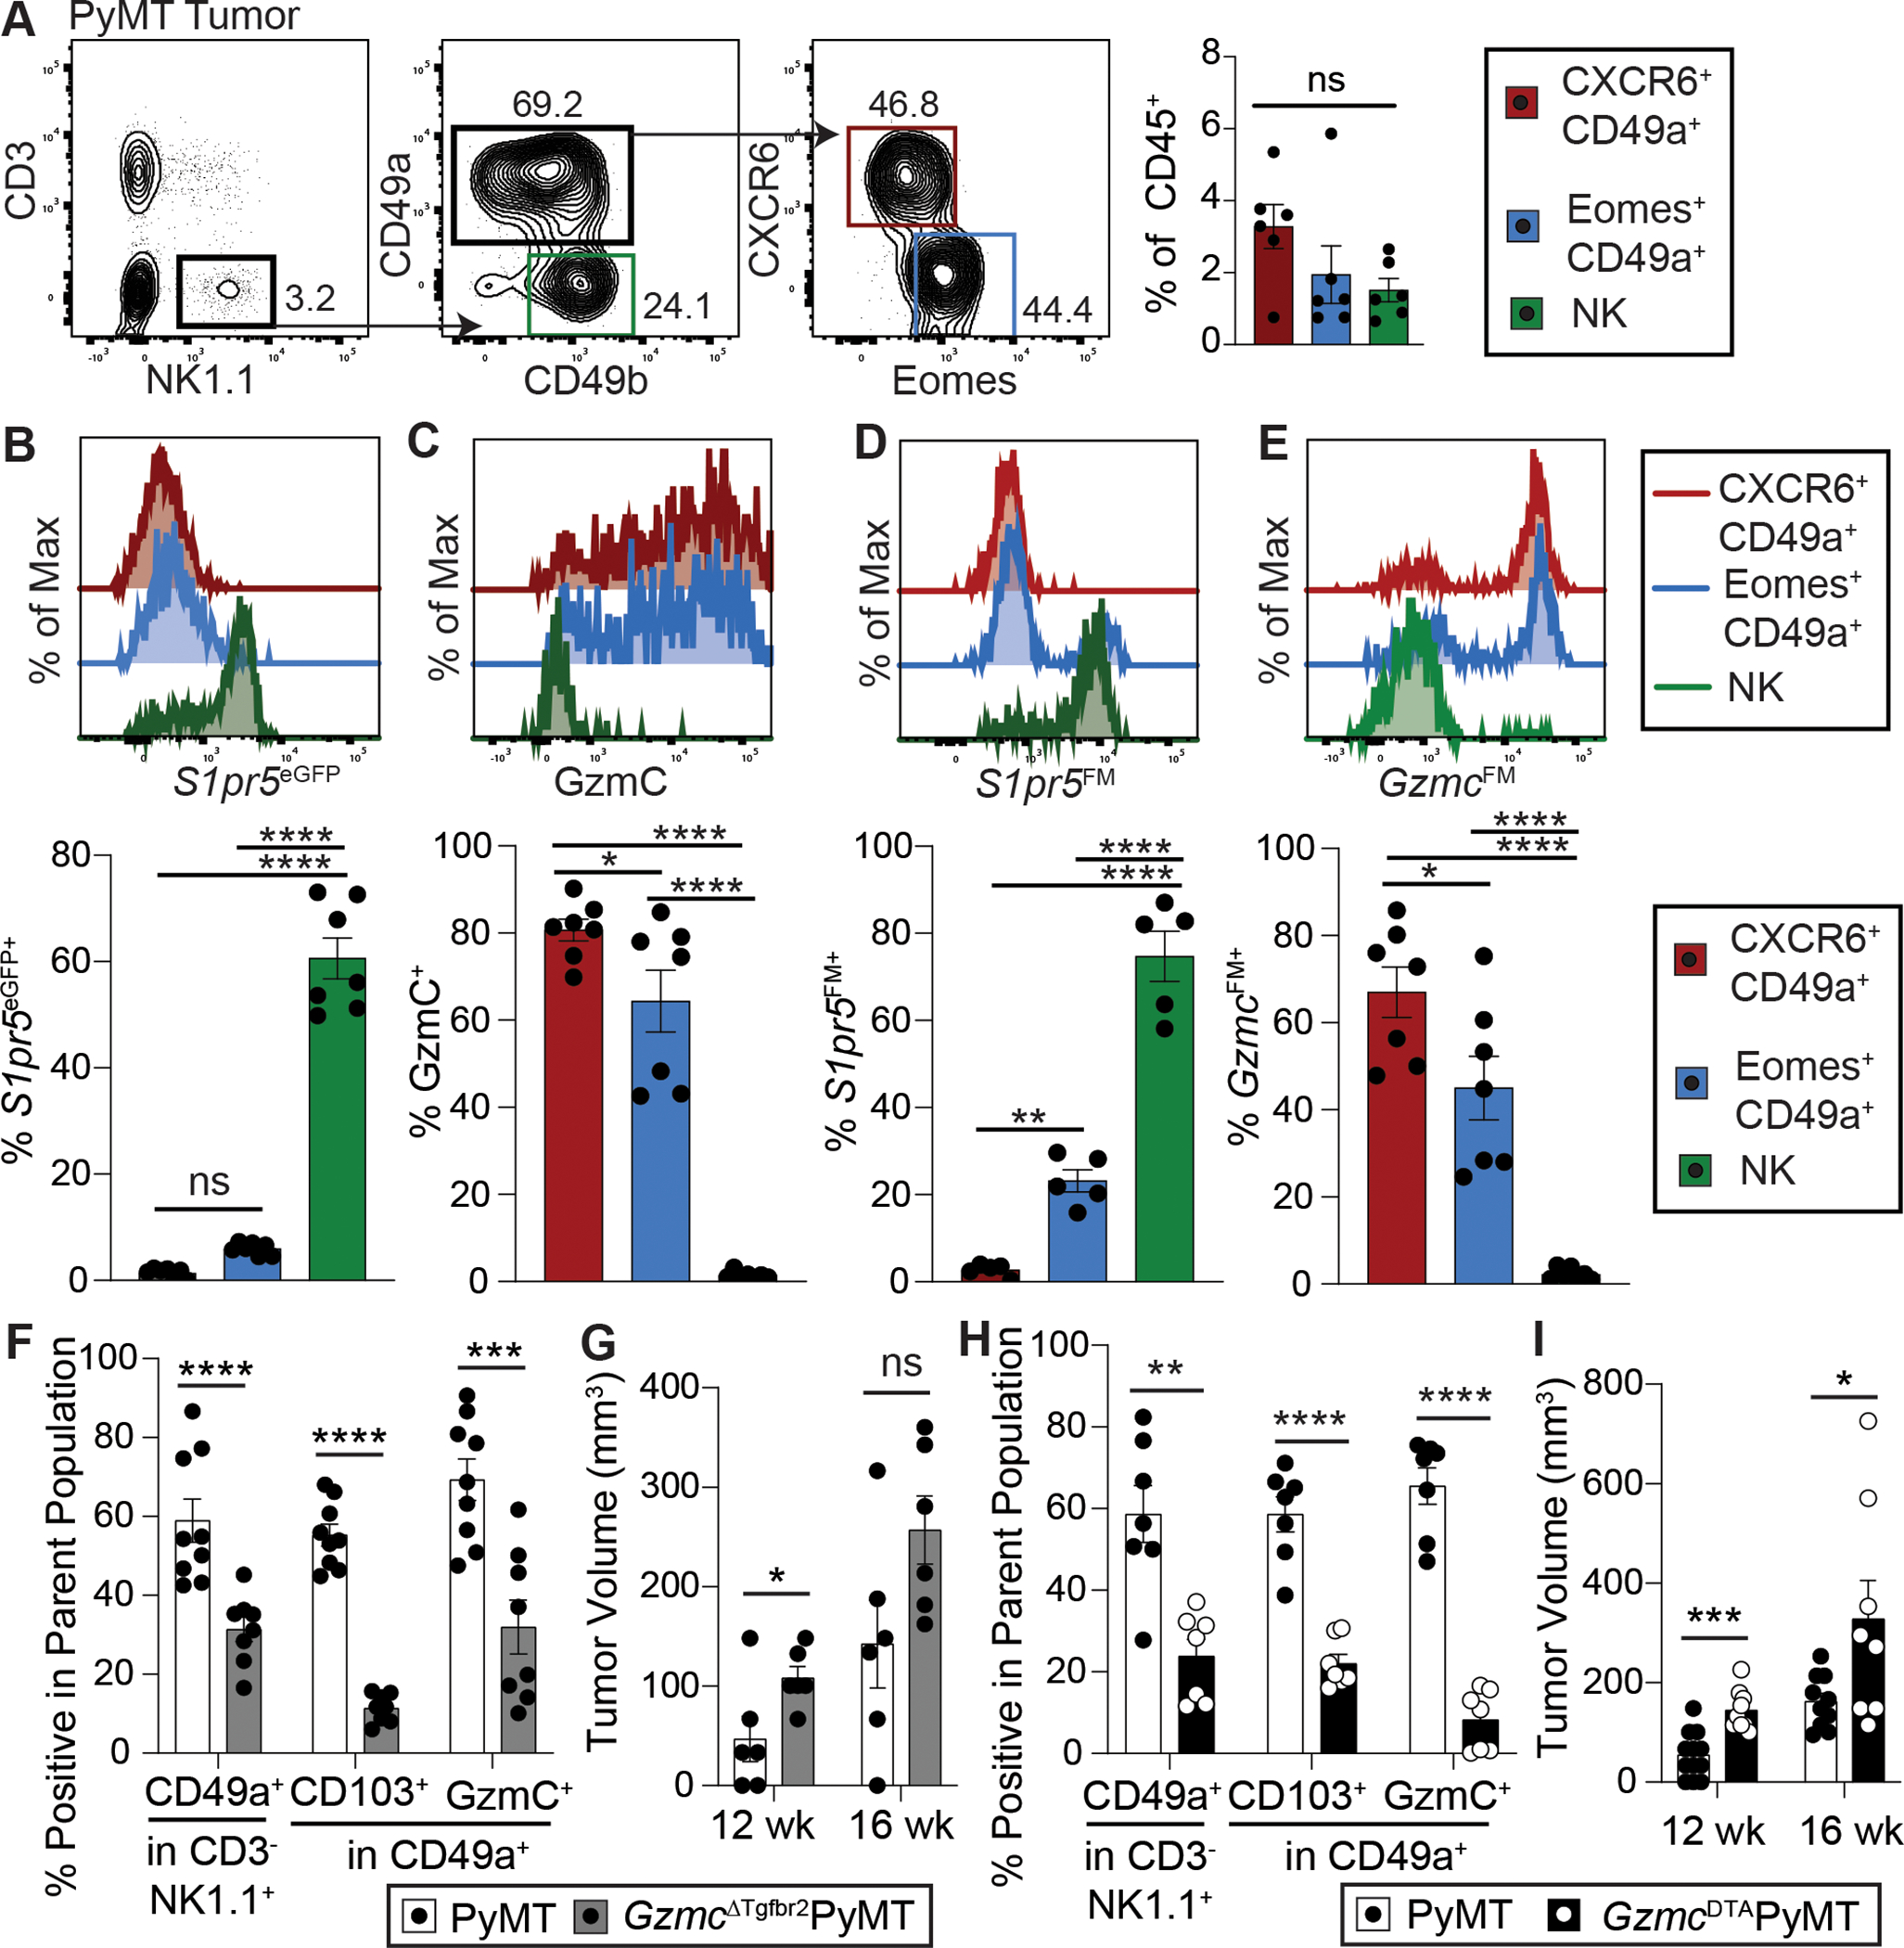
Figure 5. Granzyme C-expressing ILC1s expand and mediate cancer immunosurveillance in the PyMT model of breast cancer.

A. Abundance of CXCR6+CD49a+NK1.1+CD3− (CXCR6+CD49a+), Eomes+CD49a+NK1.1+CD3− (Eomes+CD49a+) and CD49a−CD49b+NK1.1+CD3− (NK) cells out of total CD45+ cells in PyMT tumors. Expression of S1pr5eGFP (B), granzyme C (GzmC) (C), S1pr5FM (D), and GzmcFM (E) in CXCR6+CD49a+ ILC1 (red), Eomes+CD49a+ ILC1 (blue), and CD49a−CD49b+ NK cell (green) populations in PyMT tumors of S1pr5eGFPPyMT (B), PyMT (C), S1pr5FMPyMT chimera (D), and GzmcFMPyMT (E) mice. F. Abundance of ILC1s in tumors of PyMT (white bar) and GzmCiCreTgfbr2fl/flPyMT (GzmcΔTgfbr2PyMT) (gray bar) mice, quantifying CD49a+ cells among NK1.1+CD3− cells and CD103+ and GzmC+ cells among CD49a+NK1.1+CD3− cells in the tumor. G. Tumor volume at 12 and 16 weeks of age from PyMT (white bar) and GzmcΔTgfbr2PyMT (gray bar) mice. H. Abundance of ILC1s in tumors of PyMT (white bar) and GzmCiCreRosa26LSL-DTA/+ PyMT (GzmcDTAPyMT) (black bar) mice, quantifying CD49a+ cells among NK1.1+CD3− cells and CD103+ and GzmC+ cells among CD49a+NK1.1+CD3− cells in the tumor. I. Tumor volume at 12 and 16 weeks of age from PyMT (white bar) and GzmcDTAPyMT (black bar) mice. Each dot represents one mouse (n = 5–9 mice per group). All data are combined from three or more independent experiments and shown as mean +/− SEM (unpaired student’s t-test for two groups, one-way ANOVA with Tukey’s multiple comparisons test with more than two groups, “ns” = not significant, * = p<0.05, ** = p<0.01, *** = p<0.001, **** = p<0.0001).
