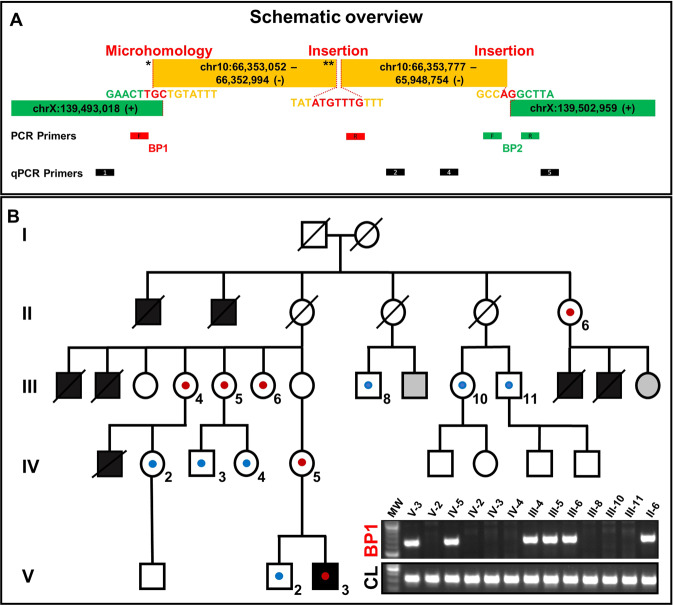
Fig. 2. Schemativ overview of the complex chromosomal rearrangement and Segregation analysis.
A The patterns found at the two breakpoint junctions (i.e. microhomology, small insertions, large template insertion, deletion at insertion site) resemble typical characteristics that arise due to replication-based repair mechanisms like MMBIR/FoSTes. The proximal breakpoint junction (BP1) comprises two joint points (indicated by asterisks). Location of primers for break point spanning PCR and qPCR. B Pedigree showing our proband (V-3) and his five-generation family with seven affected male neonates. Schematic view of the co-segregation analysis: blue dots indicate presence of the wild type chromosome X, red dots show the presence of the derivative chromosome X. PCR amplification of the proximal breakpoint junction (BP1) (exemplary). CL control locus PCR, gray filled = not consented for testing.

