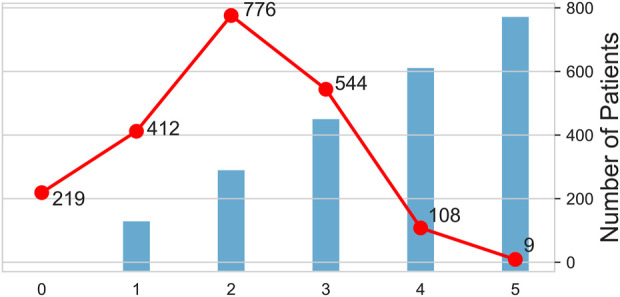
FIGURE 3.

Pattern and number of antibiotics used. The columns show the number of antibiotics used, and the broken lines shows the number of people taking drugs. The horizontal axis shows the number of antibiotics used. 0 indicates that no antibacterial drugs have been used, one indicates that only one antibacterial drug has been used, and two indicates the combination of two antibacterial drugs, and so on for 3, 4, and 5.
