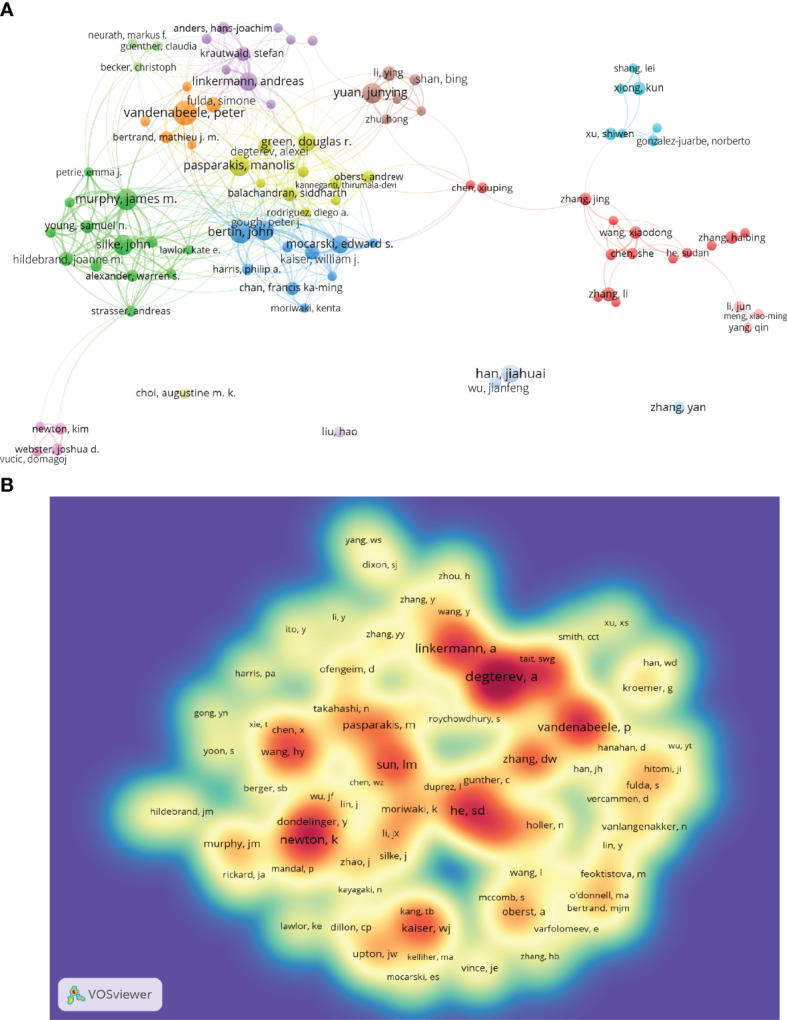
Figure 4.

The co-occurrence authors’ (A) and co-cited authors’ (B) map of necroptosis research. (A) Authors with documents ≥10 (cluster map). The size of node reflects the authors’ co-occurrence frequencies, the link indicates the co-occurrence relationship between authors, the thickness of the link is proportional to the number of publications two researchers have co-authored, and the same color of node represents the same cluster. (B) Co-cited authors with citations ≥100 (density map). The size of word, the size of round, and the opacity of yellow are positively related to the co-cited frequency.
