FIGURE 8.
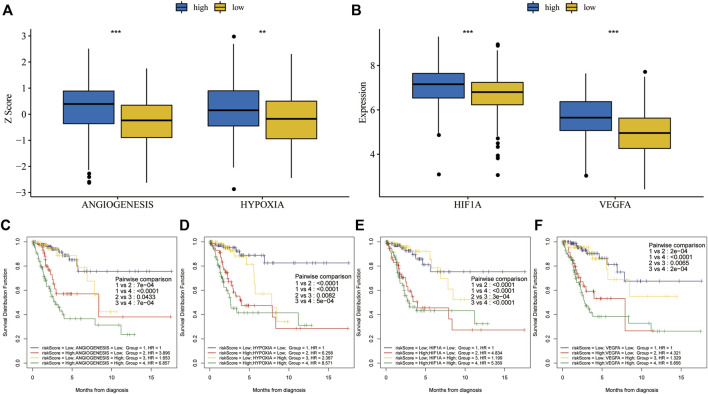
Combined survival analysis of risk scores and key cancer hallmarks in the training set. (A) Hypoxia and angiogenesis z-scores were significantly higher in the high-risk group. (B) HIF1A and VEGFA expression levels were significantly higher in the high-risk group. (C,D) The prognosis was worse in patients with high risk scores and high hypoxia or angiogenesis z-scores, according to KM analysis for OS after combining risk scores and key cancer hallmarks. (E,F) The prognosis was worse in patients with high risk scores and high HIF1A or VEGFA expression, based on KM analysis for OS after combining risk scores and genes related to key cancer hallmarks.

