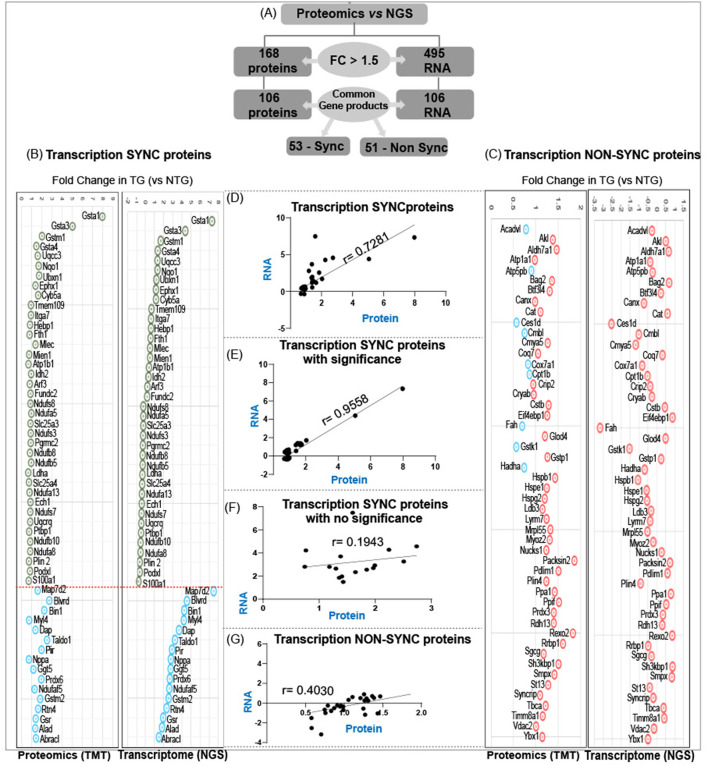
Figure 3.
Analysis of transcription-sync versus transcription-non sync proteins in RS hearts. (A) Out of 106 commonly found gene products in NGS (RNA) and respective translational products (proteins by TMT) at a FC > 1.5, the levels of 50 proteins are not consistent with their RNA levels (either up or down regulated). Proteins that are steadily expressed according to their respective mRNA levels are classified as “transcription-sync proteins” (B) and the ones that do not match with their mRNA levels are termed as “transcription-nonsync proteins” (C). (D,E) A strong positive correlation (r = 0.955) was observed among 38 of transcription-sync proteins (C), but a weak positive correlation (r = 0.194) for 16 transcription-sync proteins (F). Transcription-nonsync proteins showed a negative correlation (G).

