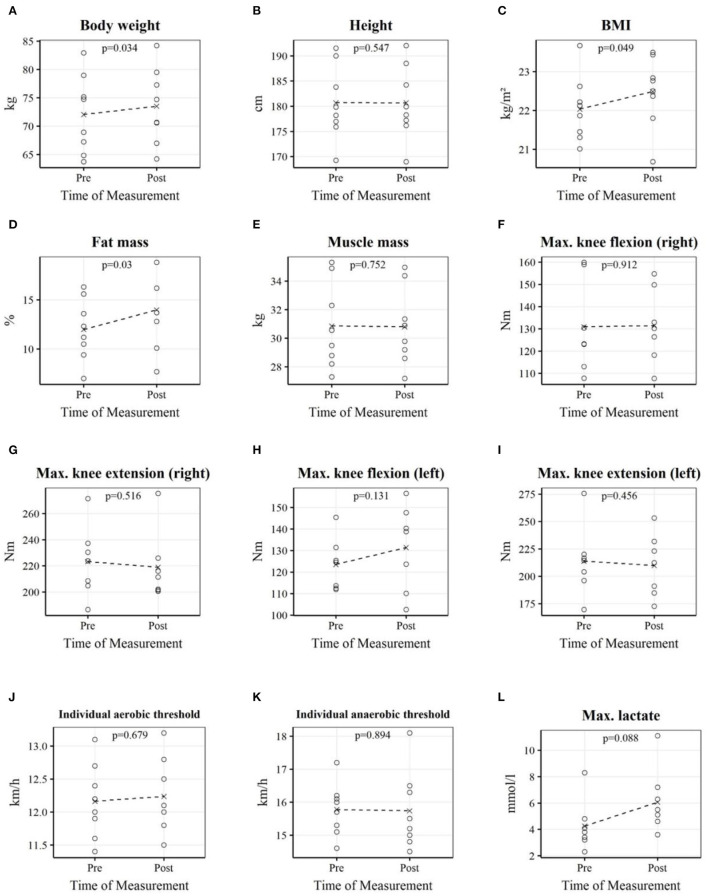
Figure 1.
Each plot depicts professional youth soccer players' individual measurements as well as the mean before and after the home training period. Body weight (A); Height (B); BMI (C); Fat mass (D); Muscle mass (E); Max. knee flexion (right) (F); Max. knee extension (right) (G); Max. knee flexion (left) (H); Max. knee extension (left) (I); Individual aerobic threshold (J); Individual anaerobic threshold (K); Max. lactate (L).

