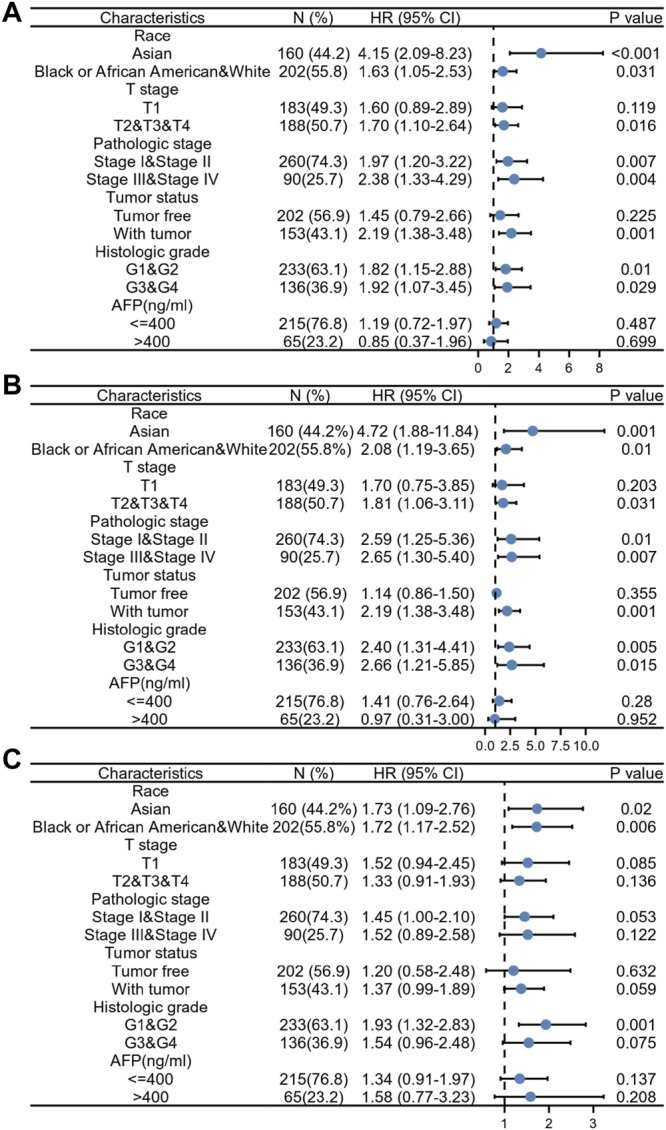
FIGURE 10.

Prognostic performance of EXO1 expression in different HCC patient subgroups. The HCC patients were divided into different subgroups based on race, T stages, pathologic stages, tumor status, histologic grades, and AFP levels. (A–C) The Cox regression analysis results show the prognostic performance of EXO1 expression levels regarding (A) overall survival, (B) disease-specific survival, and (C) progression-free interval in different subgroups of HCC patients. The results are represented by the hazard ratio (HR). The bar represents the 95% confidence interval (CI) of the HR values and the size of the diamond represents the significance of the prognostic performance EXO1.
