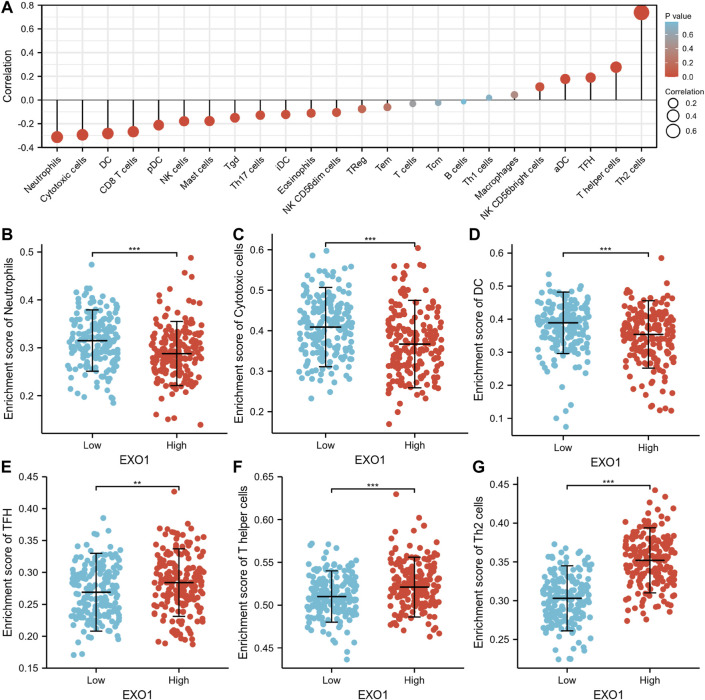
FIGURE 3.
The correlation analysis between immune cell infiltration and EXO1 expression in HCC. (A) Spearman’s correlation analysis results between infiltration levels of 24 immune cell types and EXO1 expression levels in the HCC tissues. (B–G) The infiltration levels of (B) neutrophils, (C) cytotoxic cells, (D) DC cells, (E) TFH, (F) T helper cells, and (G) Th2 cells in the high- and low-EXO1 expression groups. Note: DC, dendritic cells; pDC, plasmacytoid DC; NK, natural killer cells; Tgd, T gamma delta; Th17, type 17 Th cells; iDCs, immature DCs; TReg, regulatory T cells; Tem, T effector memory; Tcm, T central memory; Th1 cells, type 1 Th cells; aDC, activated DC; TFH, T follicular helper; Th2, type 2 Th cells.

