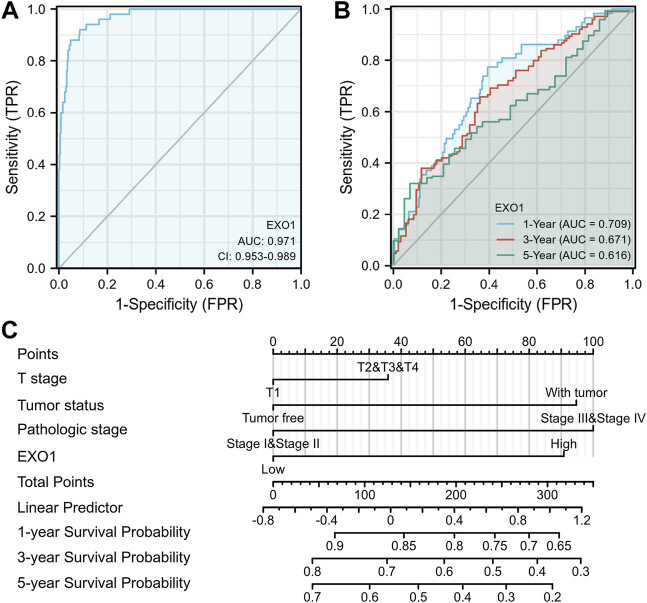
FIGURE 9.
The nomogram model with EXO1 shows a superior diagnostic and prognostic performance in HCC. (A) Diagnostic ROC curves to distinguish HCC tissues and normal tissues based on the EXO1 expression levels. (B) Time-dependent survival ROC curves to predict 1-, 3-, and 5-year survival rates of HCC patients based on the EXO1 expression levels. (C) ROC curve analysis to evaluate the prediction efficacy of the nomogram model that includes clinicopathological factors (T stages, tumor status, and pathologic stages) and EXO1 expression levels to predict the 1-, 3-, and 5-year survival rates of HCC patients.

