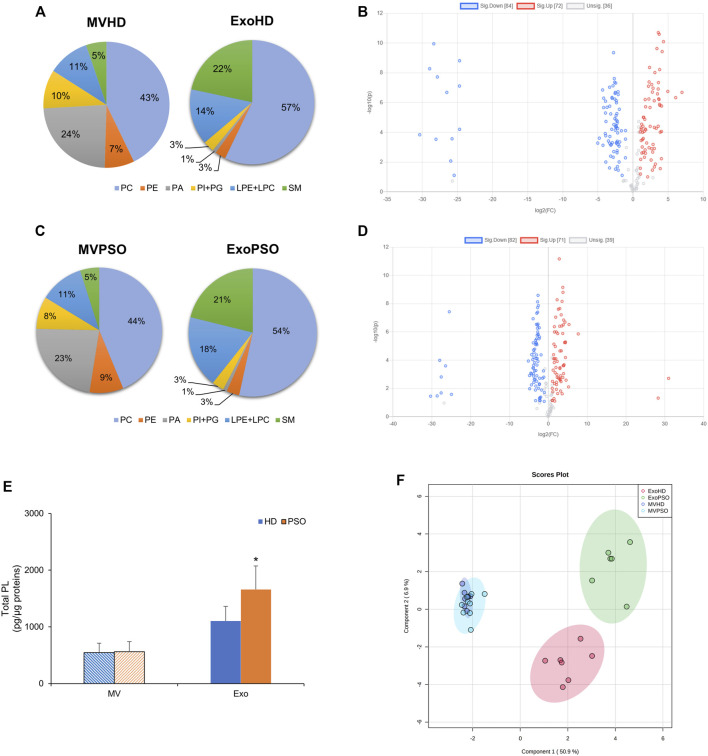
FIGURE 2.
Statistical analysis of phospholipids detected in EVs from HD and PSO. (A) Pie charts of the percentage of each phospholipid class in MVHD and ExoHD. (B) Volcano plot of individual lipid species in MVHD and ExoHD. Lipids in blue and red were increased and decreased in MVHD vs. ExoHD, respectively (FC > 2 and p-value < 0.1). (C) Pie charts of the percentage of each phospholipid class in MVPSO and ExoPSO. (D) Volcano plot of individual lipid species in MVPSO and ExoPSO. Lipids in blue and red were increased and decreased in MVHD vs. ExoHD, respectively (FC > 2 and p-value < 0.1). (E) Amount of phospholipids (PL) relative to protein content. Data are reported as mean ± S.D. (*p < 0.05, PSO vs. HD). (F) PLS-DA of lipid species from HD and PSO, both for MV and Exo. 95% ellipses are constructed on each of the four groups. The dataset was normalised by median and scaled by Pareto algorithm.

