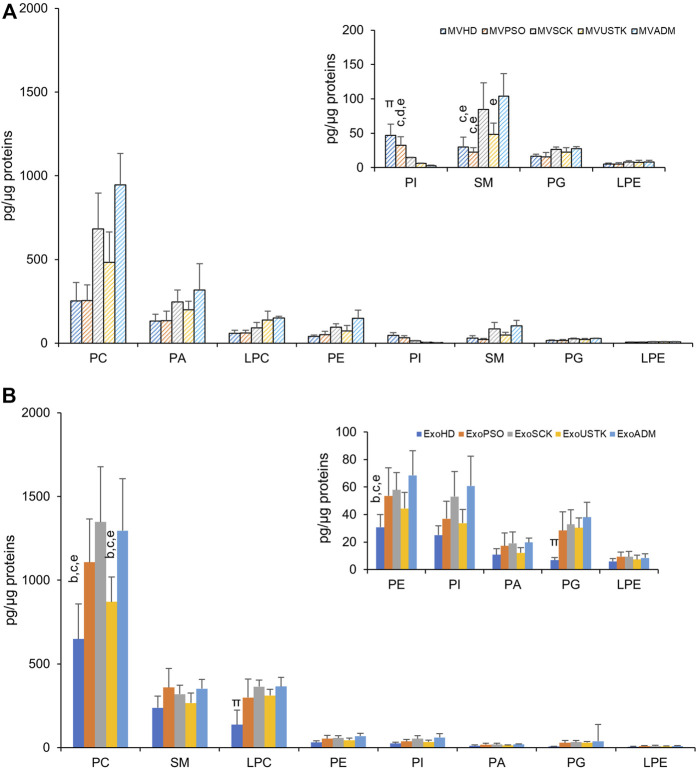
FIGURE 3.
Phospholipid composition of EVs derived from plasma of HD, PSO and PSO treated with SCK, USTK and ADM. Lipid extracts from MV (A) and Exo (B) were analyzed by LC-MS. The amount of each PL class (sum of all detected species) is expressed as pg of lipids/µg of proteins. Data are reported as mean ± S.D. Statistically significant differences (p < 0.05) resulted by one-way ANOVA and Tukey’s post-hoc analysis; columns with different letters are significantly different (i.e. a vs. HD, b vs. PSO, c vs. SCK, d vs. USTK, e vs. ADM and π vs. all).

