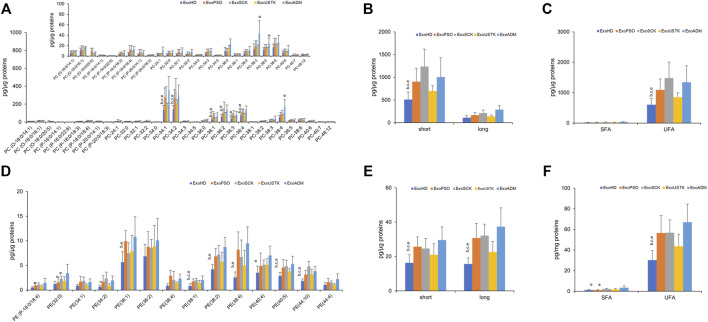
FIGURE 4.
Molecular species of PC and PE detected in Exo from plasma of HD, PSO and PSO treated with SCK, USTK and ADM. Lipid extracts from Exo were analyzed by LC/MS–MS. Panels (A) and (D) show PC and PE detected species, respectively. Data are expressed as pg of lipid species/μg of proteins. The inserted panel expand the vertical axis to allow comparison of low abundance lipid subclasses. Panels (B) and (E) show fatty acid length in PC and PE, respectively. Data are reported as sum of species containing short (<36 carbon atoms) and long chains (>38 carbon atoms). Panels (C) and (F) show saturation level of PC and PE, respectively. Data are reported as sum of molecular species containing only saturated (SFA) and unsaturated (UFA) fatty acids. Data are reported as mean ± SD; p < 0.05 was considered statistically significant by one-way ANOVA and Tukey’s post-hoc analysis; columns with different letters are significantly different (i.e. a vs. HD, b vs. PSO, c vs. SCK, d vs. USTK, e vs. ADM and π vs. all).

