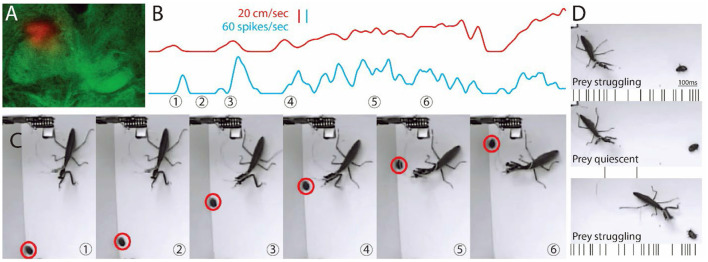
Figure 1.
Images from video and recording of a single unit during hunting behavior. (A) Location of a tetrode is shown in the dorsal region of the FB on the mantis's right side. (B) Shows the activity of the cell (blue) along with the movement of the prey (red). (C) Sample frames from Supplementary Video S1 are shown with time of frame numbers indicated in (B). (B,C) Prey starts to move in first frame. Central complex (CX) unit activity increases and then stops when the prey stops (2nd frame). In frame 3, the prey runs as the mantis tracks it, and CX unit activity increases and is maintained through frame 6. Before the mantis tracks the prey, the single CX unit is correlated with mantis movement (r > 0.7, sliding Pearson's coefficient). After the mantis orients toward the prey, the same unit is correlated (r > 0.7) with prey movement. (D) Another prey is on its back and struggles (top) and then stops (middle) and struggles again just before the strike. Activity, shown here as spikes below each frame, is parallel to movement.

