Figure 4.
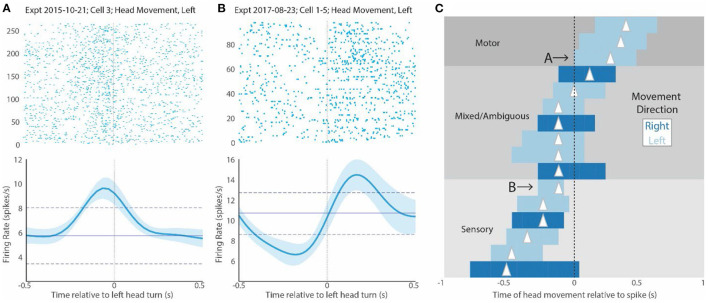
CX activity relative to mantis movement. (A) Raster plot of several responses associated with head movement of any kind for a sample cell. The 0 point here indicates the beginning of the head movement. The plot underneath shows the mean and SD firing response of all trials in the raster display. Note that the peak firing precedes the head movement, suggesting that it could contribute to driving the movement. (B) Shows a similar display for another cell that responds after the head movement (to the right of 0). This suggests that this cell responds to either proprioceptive or visual inputs associated with the turn or corollary discharge of the motor commands. (C) Shows bars indicating the peaks of STRF plots for all cells that were above 2 SDs. As in Figure 3B, the length of the bar indicates duration above 2 SDs, and the triangle indicates the peak of the curve. Dark blue bars are associated with rightward head movements, and light bars are associated with leftward head movements. In this display, bars to the left of 0 indicate regions where head movement precedes increase in spiking (0 point). We have labeled bars that are complete in this region as “sensory.” In contrast, bars to the right of 0 indicate responses where increases in spike activity (0 point) precede movement. We have labeled bars that are complete in this region as “motor”. Bars that span both regions relative to the 0 point are labeled mixed or ambiguous. They could be involved in both motor and sensory effects. Cells whose activity is displayed in (A,B) are indicated with letters and arrows. Note that the relationship of the STRF plots relative to the 0 point is the opposite of that seen in the rasters. That is because the 0 point in the STRF plots indicates the point where spike activity increases, whereas the 0 point in the raster display is the point where movement commences.

