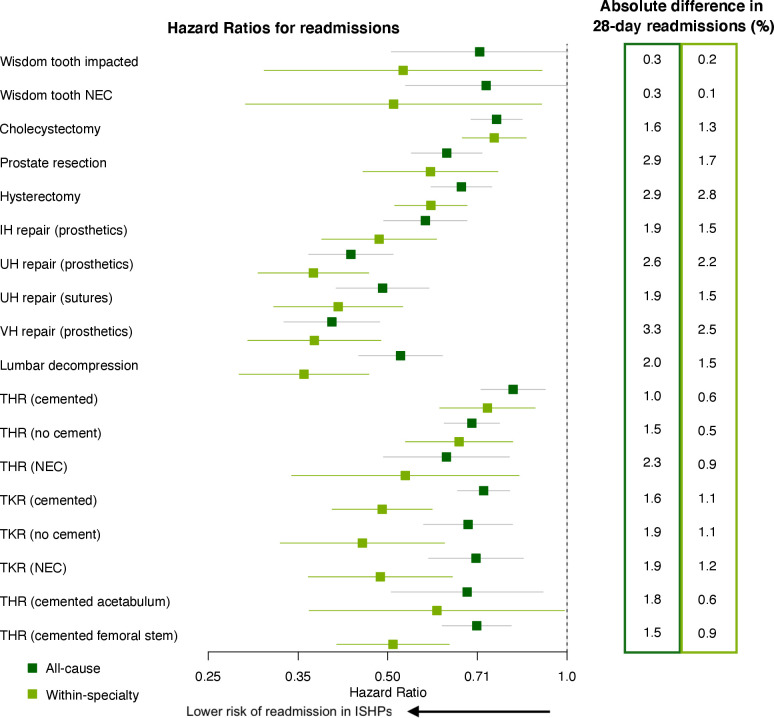
Figure 4.
HRs and 95% CIs for the effect of provider type on time to emergency readmission. Unadjusted Cox regression was used, with clustering of operations within hospital sites accounted for in order to calculate robust SEs. Within-specialty admissions are shown in light green while all-cause readmissions are shown in dark green. An HR less than 1 indicates a lower risk of such a readmission for patients treated in Independent Sector Healthcare Providers (ISHP). On the right-hand side, the corresponding absolute difference in the number of patients readmitted within 28 days of discharge is given (category E in figure 1), as a percentage of the total number of patients discharged alive within 60 days of their operation (category C1 in figure 1). Since the number of 28-day emergency readmissions is always (for all 18 operations) greatest for patients treated at National Health Service (NHS) hospitals, this number represents the additional readmissions among patients treated at NHS hospitals, per 100 patients. The left-hand column is for all-cause readmissions while the right-hand column is for within-specialty readmissions. IH, inguinal hernia; NEC, not elsewhere classified; THR, total hip replacement; TKR, total knee replacement; UH, umbilical hernia; VH, ventral hernia.

