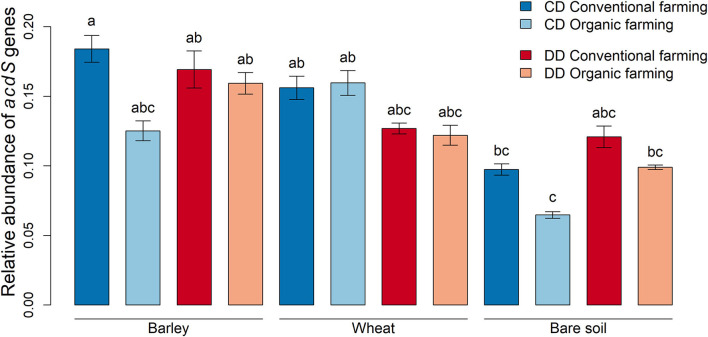
Figure 3.
Relative abundances of microorganisms with genes encoding for ACC deaminase. Abundance data obtained by qPCR were normalized with 16S rRNA gene abundances and calculated using the ΔCt method (Livak and Schmittgen, 2001). Values correspond to the average, and error bars to the respective standard error, with five pot, replicates. Letters show the statistical differences between all treatments according to ANOVA followed by Tukey's HSD post-hoc test. CD: “single water deficit,” control and dry conditions, DD: “water deficit history,” dry conditions and dry conditions.

