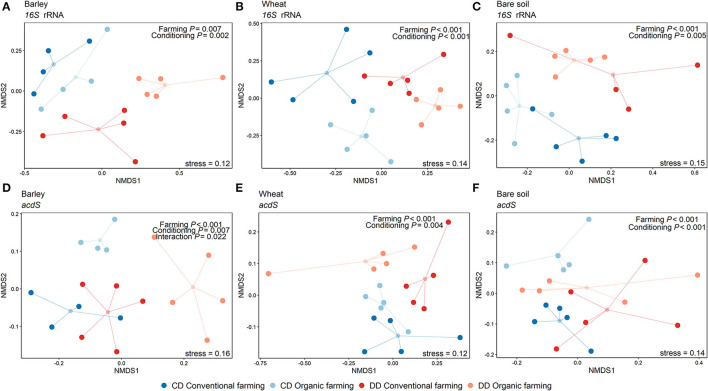
Figure 4.
Non-metric multidimensional scaling showing the effects of the farming system and watering during the conditioning phase per plant treatment. NMDS was performed on Amplicon Sequence Variants (ASV) using the Bray-Curtis dissimilarity matrix. The small circles correspond to the geometric center (centroid) of each treatment, and the lines indicate the distance of the samples to the centroid. Data from the 16S rRNA gene-based analysis are shown in subfigures a-c and acdS gene analyses are presented in subfigures d-f, for barley (A,D), wheat (B,E), and the pots without plants (C,F). Results of the PERMANOVA are indicated in each plot (n = 5 pots). CF: conventional farming, OF: organic farming, CD: “single water deficit,” control and dry conditions, DD: “water deficit history,” dry conditions and dry conditions.

