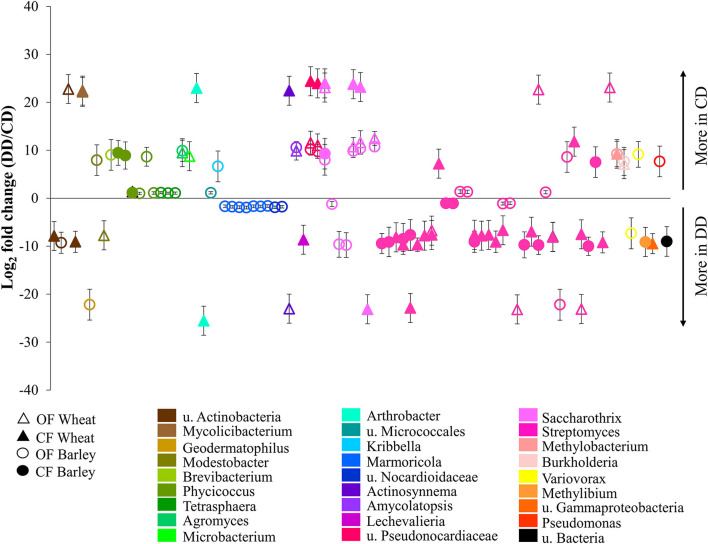
Figure 6.
Relative abundances of the acdS+ ASVs significantly impacted by drought conditioning. Taxa were identified using DESeq2 and P-value < 0.05, and log2-fold changes between respective treatments are represented. CF, conventional farming; OF, organic farming; CD, “single water deficit,” control and dry conditions; DD, “water deficit history,” dry conditions and dry conditions; n = 5 pots.

