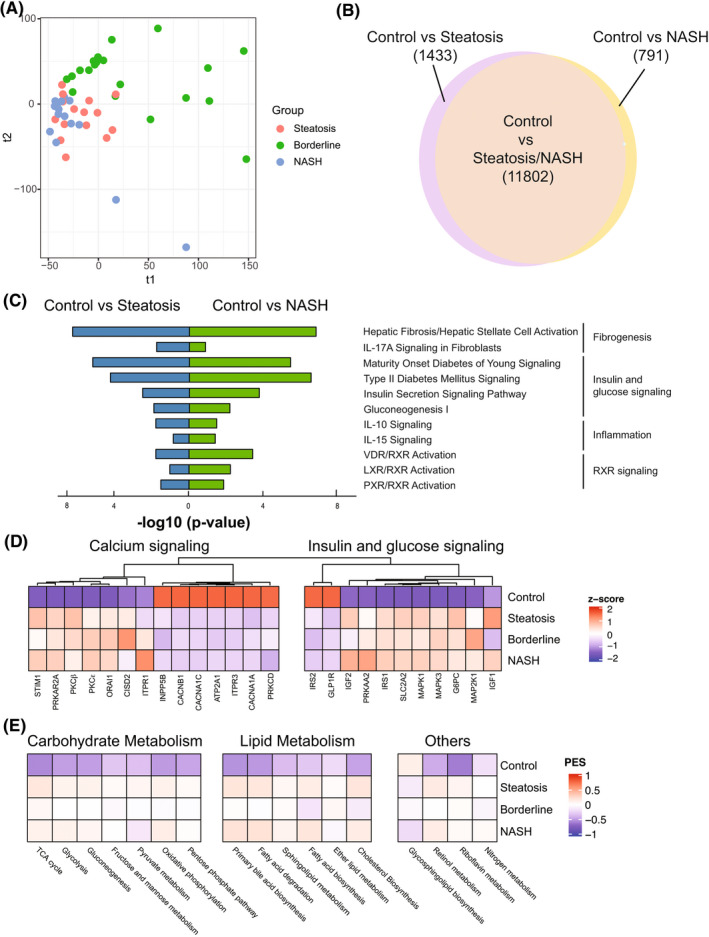
FIGURE 2.

Transcriptomic differences between different stages of control and pediatric NAFLD. (A) Patients with NAFLD visualized by the top two components of partial least‐squares discriminant analysis (PLS‐DA). (B) Venn diagram showing the number of differentially expressed genes (DEGs) in control versus indicated group. A total of 13,235 differentially regulated genes were identified between steatosis and control; 12,593 differentially regulated genes were identified between NASH and control. (C) Selected top enriched pathways grouped by biologic function. (D) Heatmap showing the normalized gene expression (represented by z‐score) of candidate NAFLD genes involved in “calcium signaling” and “insulin & glucose signaling.” (E) Pathway Enrichment Score (PES) of selected Kyoto Encyclopedia of Genes and Genomes (KEGG) metabolic pathways in normal liver and indicated NAFLD grade. IL, interleukin; LXR, liver X receptor; NASH, nonalcoholic steatohepatitis; PXR, pregnane X receptor; RXR, retinoid X receptor; VDR, vitamin D receptor
