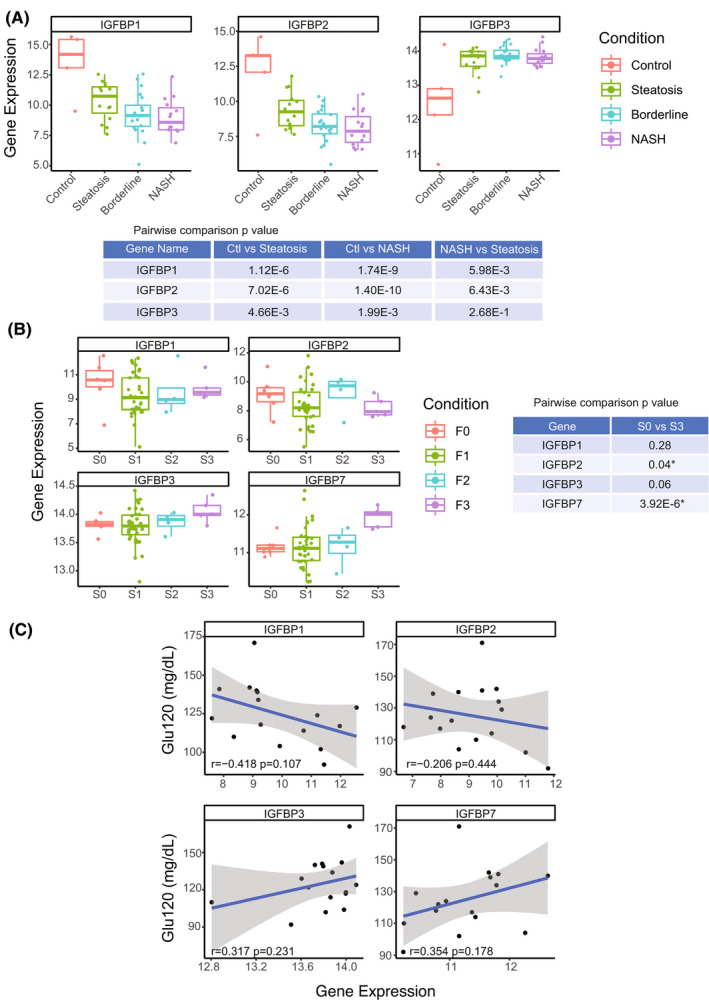
FIGURE 4.

Hepatic expression of insulin‐like growth factor binding protein (IGFBP) family correlates with pediatric NAFLD/fibrosis severity. (A) Hepatic IGFBP1, IGFBP2, and IGFBP3 expression in different stages of NAFLD: normal (n = 5), steatosis (NAFLD activity score [NAS] ≤ 3; n = 15), borderline NASH (NAS = 4 or NAS ≥ 5 with one or more subscores = 0; n = 19), and NASH (NAS > 5, subscores ≥ 1; n = 15). (B) Hepatic expression of IGFBP1, IGFBP2, IGFBP3, and IGFBP7 in different stages of fibrosis in pediatric patients with NAFLD: S0 (n = 6), S1 (n = 35), S2 (n = 4), and S3 (n = 5). *p‐value < 0.05. (C) Pearson correlation between 2‐h glucose (Glu120) value and hepatic expression of IGFBP1, IGFBP2, IGFBP3, and IGFBP7
