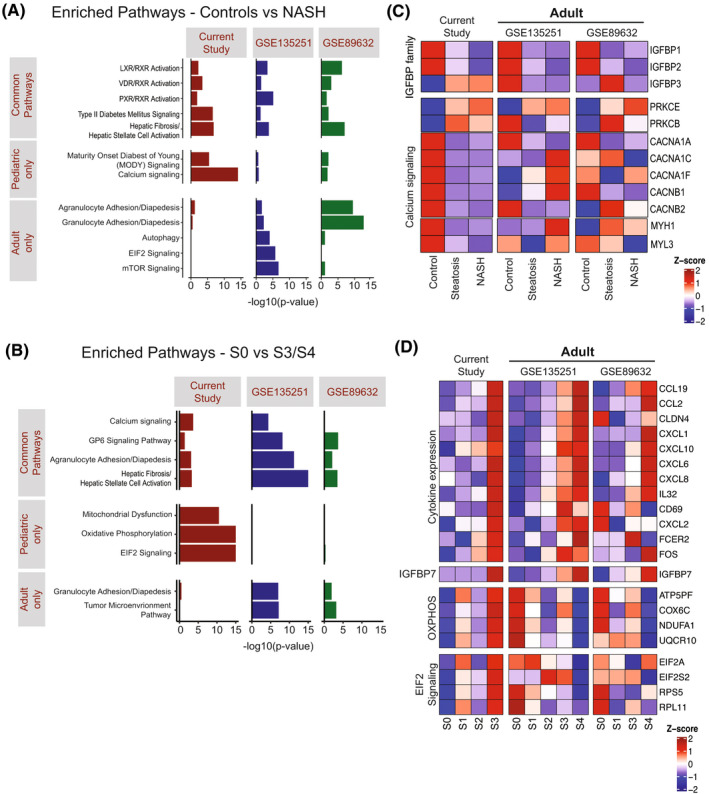
FIGURE 5.

Similarities and differences comparing pediatric with adult NAFLD studies. (A) Selected enriched pathways in pediatric and two adult NAFLD studies using all DEGs identified comparing controls versus NASH. (B) Selected enriched pathways in pediatric and two adult NAFLD studies using DEGs comparing S0 versus S3/S4 fibrosis. (C) Heatmap showing hepatic expression of selected genes related to IGFBP and calcium signaling pathway in different NAFLD stages. (D) Heatmap showing hepatic expression of selected genes/pathways with progression of fibrosis in NAFLD. OXPHOS, Oxidative phosphorylation. GSE89632: S2 patients were excluded due to small number (n = 2). (E) Diagram showing the common DEGs (false discovery rate [FDR] < 0.05, fold change > 1.5) from NASH versus control in different age groups. All of the identified DEGs here are up‐regulated in NASH
