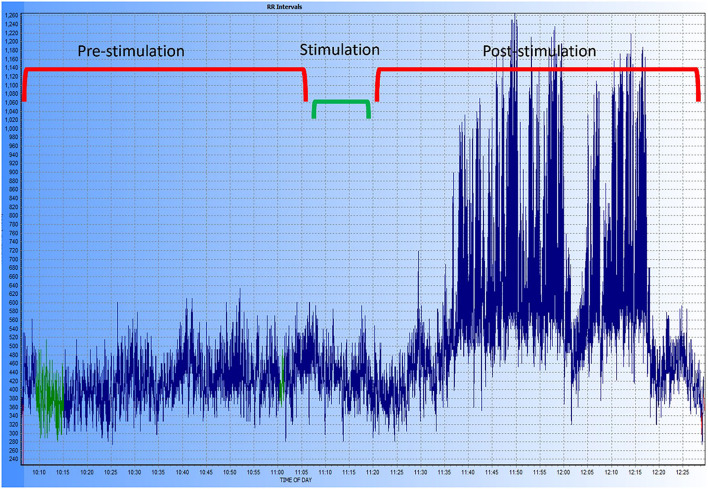
Figure 10.
Exemplary tachogram representing the R-R intervals in one of the dogs of the study. The different time periods are shown at the top of the graphic, the period labeled “stimulation” includes the 5-min pre- and post-stimulation margin used for the HRV analysis. A marked increase in HRV can be observed after stimulation and during the entire post-stimulation period recorded.

