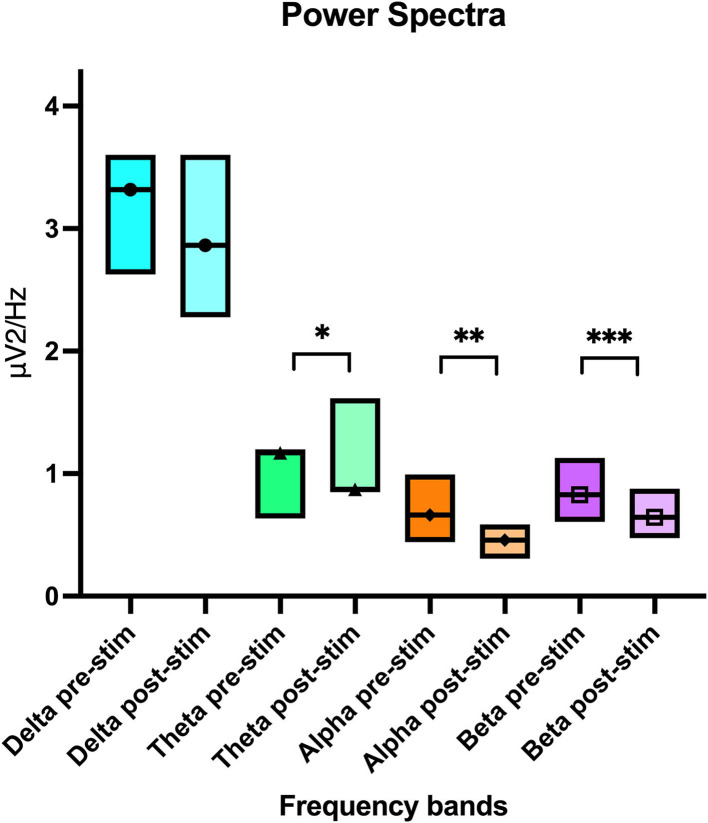
Figure 7.
Boxplot graph showing the pooled power spectral analysis mean value per electroencephalogram frequency band with the upper and lower confidence intervals. The line crossing the boxes indicate the median value obtained in that frequency band. An * denotes statistical significance of p = 0.01, ** significance of p < 0.01 and *** significance of p = 0.03.

