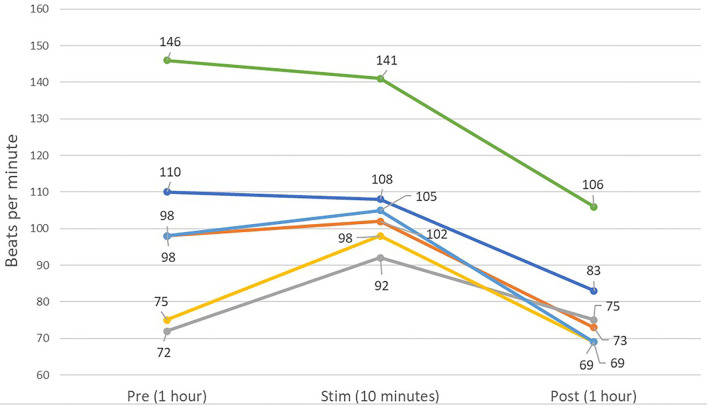
Figure 9.
Line graph showing the averaged mean heart rates of the 6 dogs over 1 h of pre-stimulation (Pre) and post-stimulation (Post), as well as the averaged mean heart rate of the 10 min of the peri-stimulation period. A decreased mean heart rate is present in the post-stimulation period for five of six dogs.

