FIGURE 2.
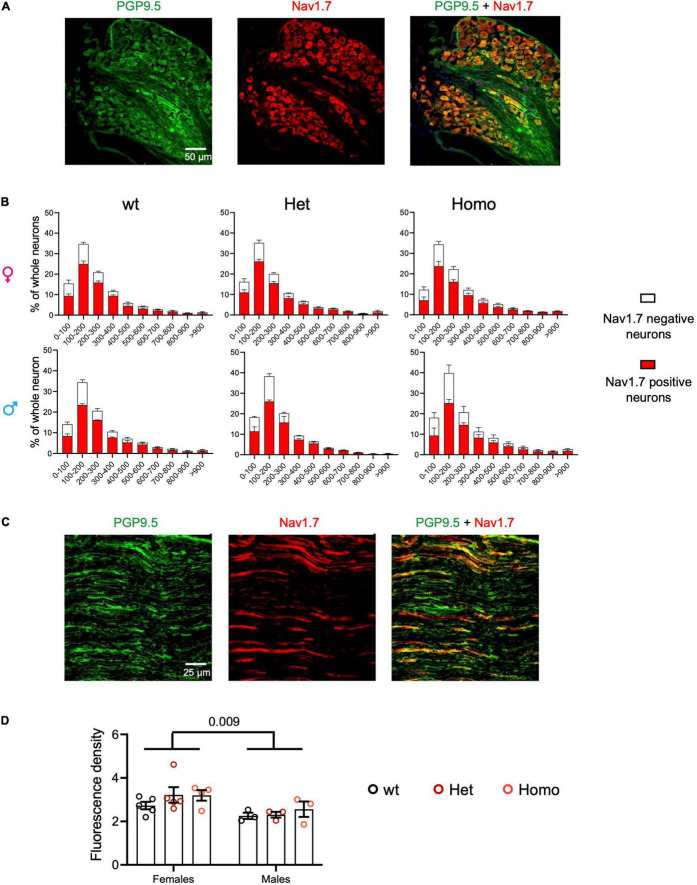
Nav1.7 protein expression of DRG and sciatic nerve in Scn9aR185H mutant mice. (A) Representative images of PGP9.5 (green) and Nav1.7 (red) fluorescent immunostaining for all neurons (PGP9.5-positive) and Nav1.7-positive neurons in lumbar DRG of wt animals. Scale bar 50 μm. (B) Size distribution for Nav1.7-positive (red) and negative (white) neuron cross-sectional areas in wt, het, and homo female and male mice. Females: n = 5/group; male: n = 3/group. Results are shown as means ± SEM. The two-way ANOVAs for genotype and neuron size effects in each sex showed a size effect and no genotype effect. (C) Representative images of fluorescent PGP9.5 (green) and Nav1.7 (red) immunostaining of sciatic nerves of wt animals. Scale bar of 25 μm. (D) Mean fluorescence density Nav1.7 immunostaining of sciatic nerves in wt, het, and homo female and male mice. Females, n = 4–5/group; males, n = 3/group. Results are shown as means ± SEM. The two-way ANOVA for genotype and sex indicated a sex effect and no genotype effect. The P value of 0.009 is for sex effect. See Supplementary Table 6 for statistics.

