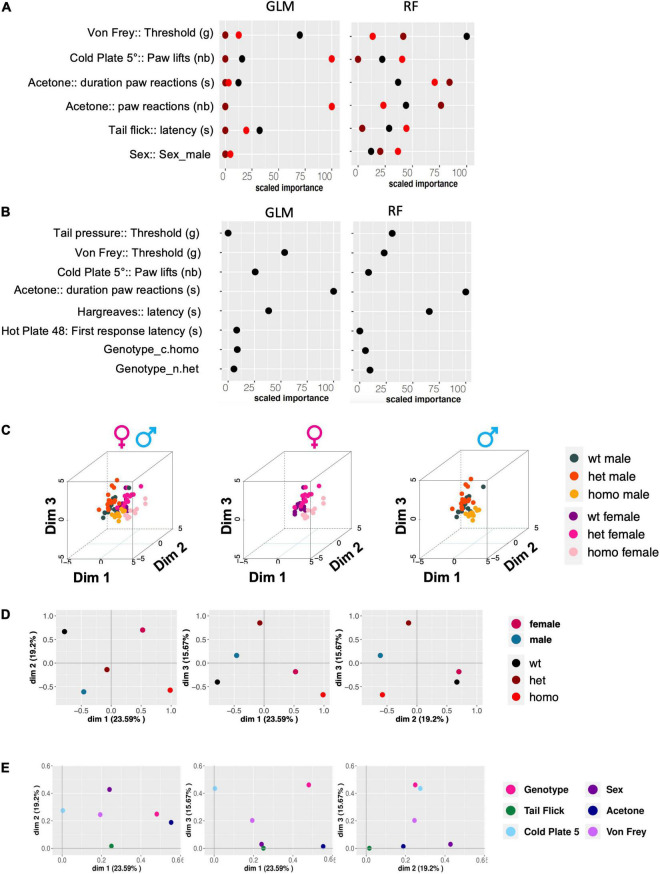
FIGURE 5.
Gdaphen analyses to identify the variables contributing the most to genotype and sex discrimination. (A) Identification of the power of each explanatory phenotypic variable to the genotype discrimination. GLM, Generalized Linear Model; RF, Random Forest. The explanatory variables selected were the ones found to contribute more than a 30% to the genotype discrimination. (B) Identification of the power of the explanatory phenotypic variables contributing to more than 30% to the genotype discrimination, analyzed to see for different responses based on sex and using the two different statistical GLM and RF classifiers. (C) 3D-PCA plots showing the individual animals clustering in 3D space based on PCA analyses performed with all the phenotypic variables and colors based on the genotype and sex. Left panel shows individuals of both sexes, the middle plots female data, and the right plot male data. (D,E) The qualitative variable discrimination component maps show the distribution in 2D space of the qualitative variables coordinates calculated based on PCA analysis performed with the multifactor analysis of mixed data (MFA). In panel (D), the variables female, male, wt, het, and homo are represented. In panel (E), the variables genotype, sex, tail flick, acetone, cold plate, and von Frey are shown.

