FIG. 2.

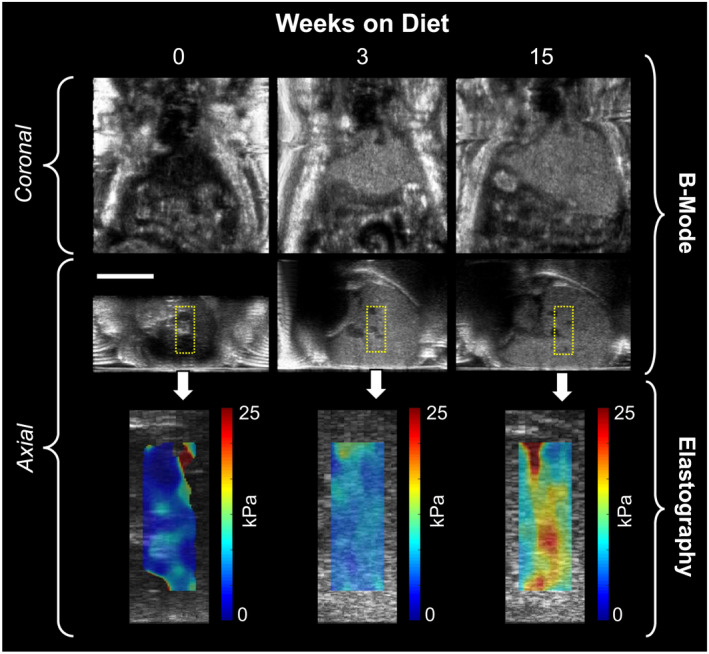
Representative ultrasound images from a single mouse at three timepoints (0, 3, and 15 weeks) on CDAHFD. The echogenicity, stiffness, and size of the liver all increase with time on diet. Scale bar indicates 1 cm.

Representative ultrasound images from a single mouse at three timepoints (0, 3, and 15 weeks) on CDAHFD. The echogenicity, stiffness, and size of the liver all increase with time on diet. Scale bar indicates 1 cm.