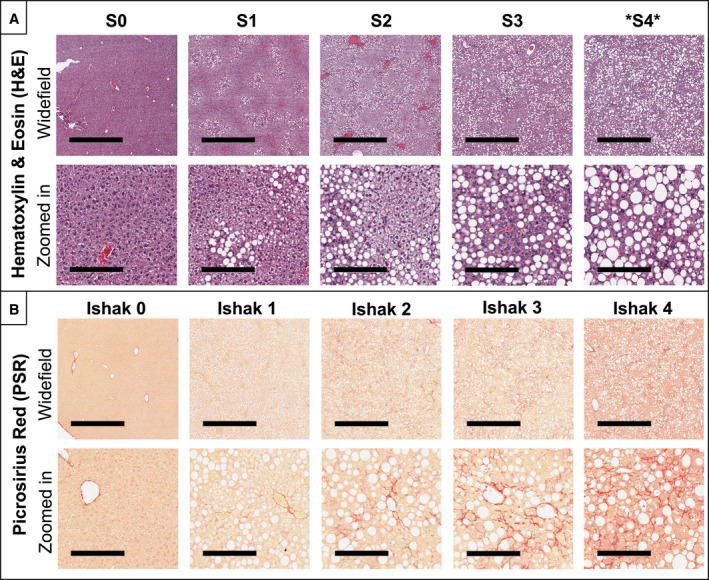
FIG. 3.

Representative histological images with disease severity category indicated above the columns. Steatosis and inflammation were evaluated using H&E staining (A), while fibrosis was evaluated using picrosirius red staining (B). For each stain, both a widefield (top) and magnified (bottom) view are presented with scale bars of 1 mm and 200 µm, respectively. Note that an additional steatosis category, “S4,” was added to the traditional rodent NALFD system to represent >66% diffuse steatosis. Macrovesicular steatosis rapidly reached S4 by 3‐6 weeks after start of diet, while fibrosis onset was a slower progression, requiring 12‐15 weeks to reach Ishak 4. The different temporal dynamics for these disease progressions can be observed in the longitudinal data presented in Fig. 5.
