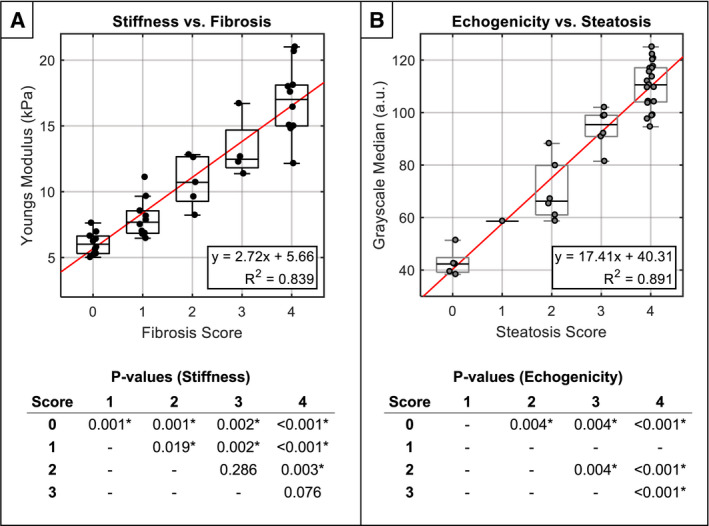
FIG. 6.

Selected comparison between noninvasive imaging and histology pairs with highest respective correlation. (A) Liver stiffness versus Ishak fibrosis score. (B) Liver echogenicity versus macrovesicular steatosis score. For clarity, P values from pairwise Mann‐Whitney U tests are provided in the tables below (α = 0.05). Note that P values for steatosis grade “1” were not computed, because only one animal was identified with this score. For full comparison matrix showing correlation plots of all imaging/histology pairs, see Supporting Fig. S2.
