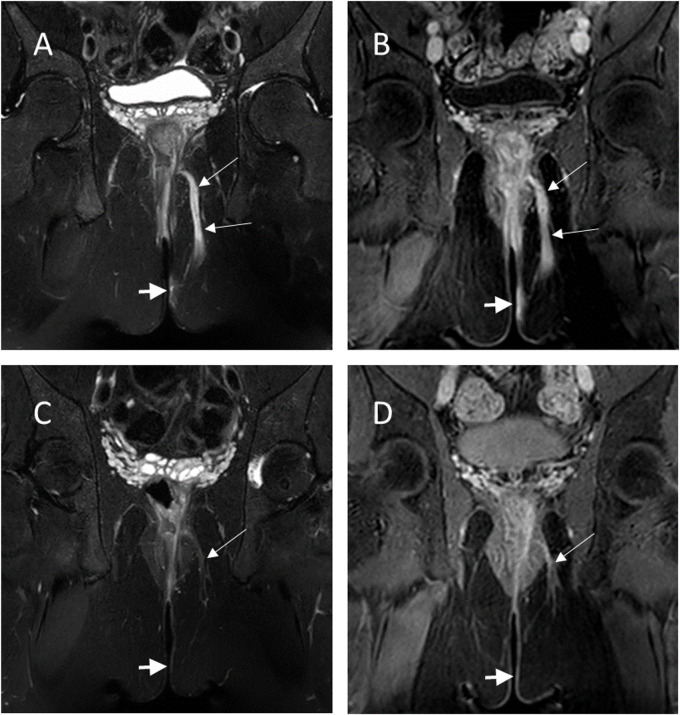
Figure 2.
MR images showing a perianal fistula (long white arrows), before (A, B) and after 3 months of biological therapy (C, D). A and C are T2-weighted fat saturated images, B and D are T1-weighted postcontrast images. Arrow heads show tissue inflammation as well as fistula tract have substantially reduced following treatment.

