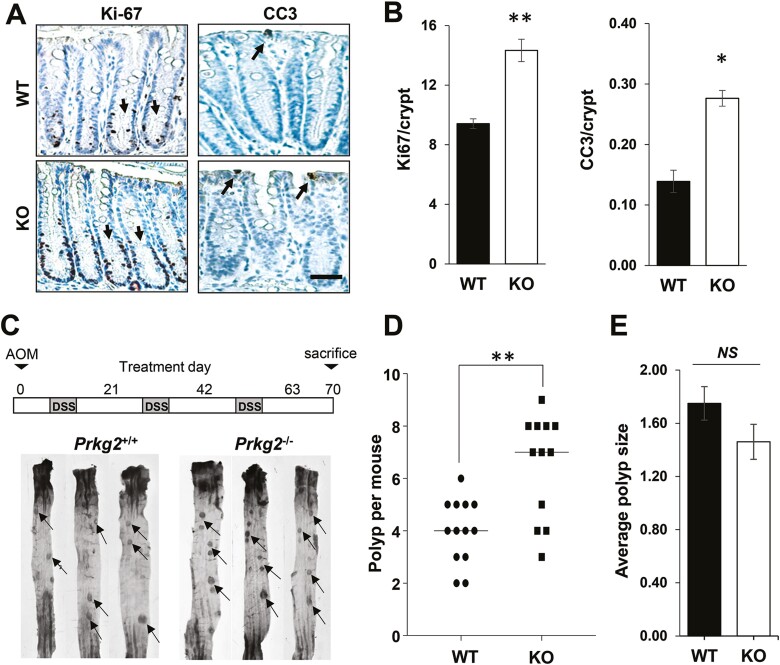
Figure 3.
PKG2-deficient mice exhibit increased crypt hyperplasia and carcinogenesis in the colon. (A) Paraffin sections of colon from WT and PKG2 KO mice were stained for proliferation (Ki-67) and apoptosis (cleaved caspase 3; CC3), and quantitated (B). Arrows in the Ki-67 panel indicate positive nuclei in the lower crypt, and in the CC3 panel they indicate apoptotic cells at the luminal surface. Data shown are means and error bars show SD. ∗P < 0.01, ∗∗P < 0.005 two tailed t-test (n = 3 mice per group). (C) Experimental outline for treating WT (Prkg2+/+, WT) and PKG2 KO (Prkg2−/−, KO) mice with the AOM/DSS model of colon cancer (upper panel). Images of distal colon and rectum of representative WT and PKG2 knock-out mice following AOM/DSS treatment (lower panel). Arrows indicate examples of polyps counted. (D) Enumeration of colorectal polyps per mouse in AOM/DSS treated animals. The line shows median value, and ∗∗P < 0.005 using a Mann–Whitney U test. (E) Mean colon polyp size in AOM/DSS treated mice. Error bars show SD, and NS indicates P > 0.05 from two-sided t-test (n = 8). KO, knockout; WT, wild type.

