Figure 4.
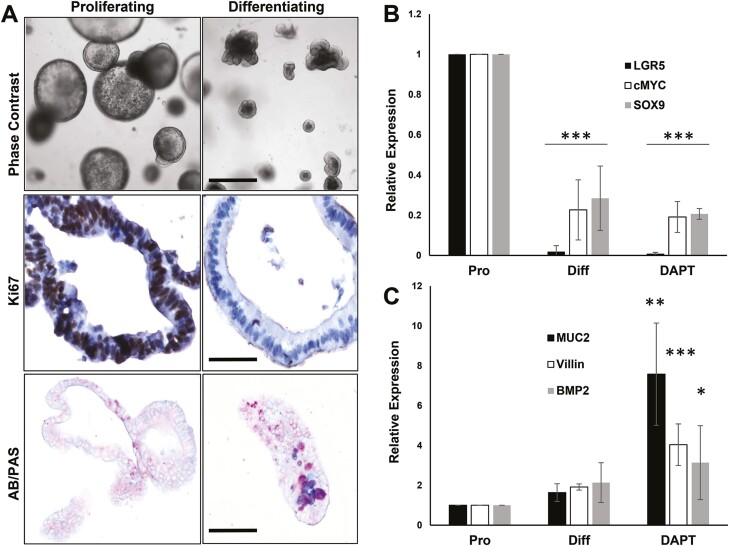
Colon organoids recapitulate the crypt-villus axis in vitro. Mouse colon organoids were maintained under proliferating and differentiation conditions as described in Materials and Methods. (A) Proliferating and differentiating organoids were imaged live using phase contrast microscopy (upper panels, scale bar = 100 µm), or processed for staining for Ki67 (proliferation; middle panels, bar = 25 µm), or alcian blue/periodic acid-Schiff (AB/PAS; bottom panels, bar = 50 µm). AB/PAS identifies goblet cells by staining mucopolysaccharides. (B) RT-qPCR analysis of β-catenin/TCF target gene expression in proliferating (Pro), differentiating (Diff) or Notch inhibitor-treated differentiating (DAPT) colon organoids. (C) RT-qPCR analysis of differentiation genes in colon organoids. The data show mean with SD error bars, n > 3. Data were analyzed using one-way ANOVA with Dunnetts multiple comparisons test for each gene relative to proliferation values. ∗P < 0.05, ∗∗P < 0.005, ∗∗∗P < 0.0005.

