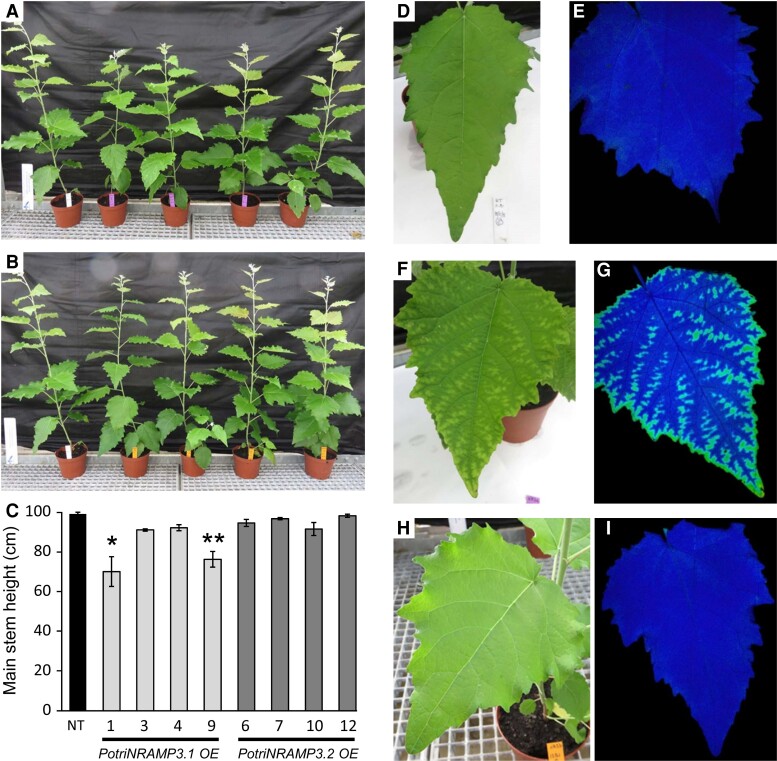
Fig. 7.
The ectopic overexpression of PotriNRAMP3.1 but not that of PotriNRAMP3.2 leads to phenotypic alterations in poplar. Overview of four independent transgenic poplar lines OE PotriNRAMP3.1-GFP (A, purple tags) or PotriNRAMP3.2-GFP (B, orange tags) along with NT control (A and B, white tag), 2 months after transfer from in vitro to soil. (C) Mean heights of poplar from the different genotypes. Error bars represent SE (n = 4–7 trees per genotype). Asterisks denote significant difference with respect to NT control according to a Mann–Whitney test (*P < 0.05, **P < 0.01). (D–I) Leaf phenotypes of representative trees. (D, E) NT control, (F, G) PotriNRAMP3.1-GFP line 9 (H, I), PotriNRAMP3.2-GFP line 12. (D, F, H) pictures; (E, G, I) PS II maximum quantum yield measured with imaging Pulse-Amplitude-Modulation. The dark tone indicates values of Fv/Fm around 0.75 close to the optimal value of 0.8, lighter tones indicate a lower value around 0.45. Relative PotriNRAMP3.1 and PotriNRAMP3.2 mRNA levels of OE lines are shown in supplementary figure S5, Supplementary Material online.

