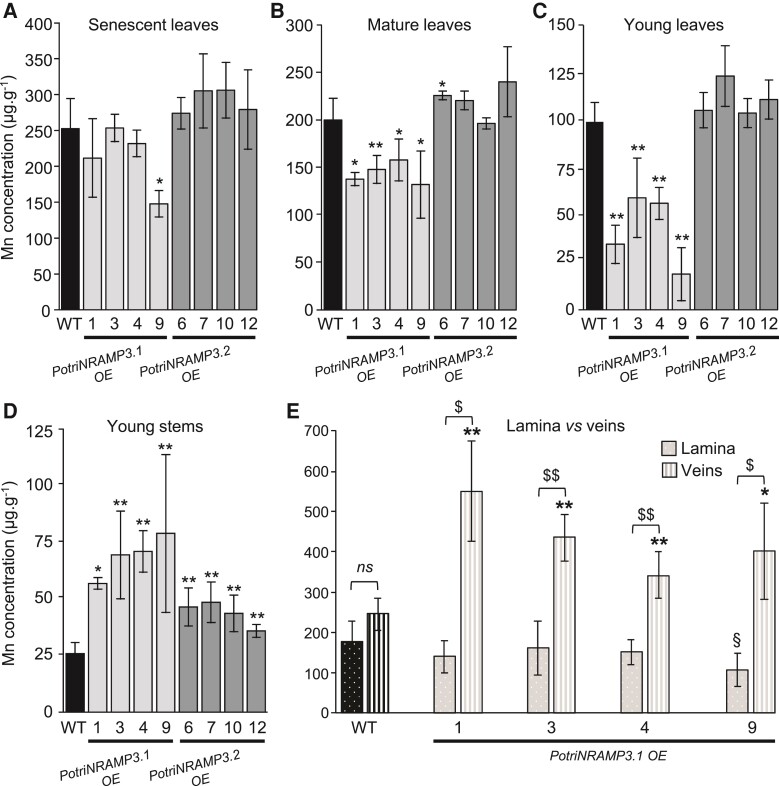
Fig. 8.
Ectopic overexpression of PotriNRAMP3.1-GFP but not that of PotriNRAMP3.2-GFP perturbs Mn distribution in poplar leaves. Mn concentrations in senescent (A), mature (B), young leaves (C), and young stems (D) of poplars 2 months after transfer from in vitro to soil were determined using atomic emission spectroscopy. Mean Mn concentrations of PotriNRAMP3.1-GFP or PotriNRAMP3.2-GFP OE lines were compared with the NT control. Error bars represent SD (n = 4–7 plants from each independent transgenic line). (E) Mean Mn concentrations in veins and lamina of mature leaves (B) from NT control and 4 PotriNRAMP3.1-GFP OE lines. Error bars represent SD (n = 4–8 leaves from 2 to 8 plants for each independent transgenic line). Symbols denote significant differences with the NT control (* or §) or between lamina and veins ($) according to a Mann–Whitney test (*/§/$: P<0.05, **/§§/$$: P<0.01).

