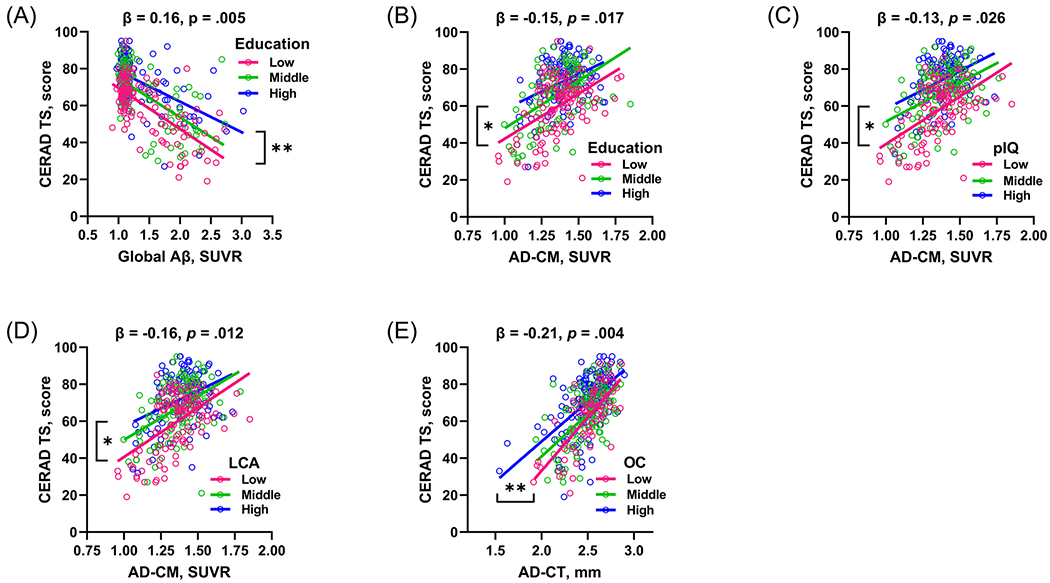
Fig. 1.

Visual representations showing the relationships between CR proxies, AD pathologies, and cognition. (A) Moderation of education for the relationship between Aβ deposition and CERAD TS. Moderation of (B) education, (C) pIQ, and (D) LCA for the relationship between AD-CM and CERAD-TS. (E) Moderation of OC for the relationship between AD-CT and CERAD-TS. Each of education, pIQ, and LCA was stratified into tertiles: Educational level was stratified into high (≥ 13 years), middle (10~12 years), and low (≤ 9) levels; pIQ was divided into high (> 120), middle (115~120), and low (≤ 114) levels; and LCA was stratified into high (> 2.6), middle (2.0~2.6), and low (≤ 1.9) levels. OC was stratified into high (3~4), middle (2), low (0~1) levels. Age, sex, and APOE ε4 carrier status are controlled as covariates. *p < 0.05; **p < 0.05; ***p < 0.001. Key: CERAD, Consortium to Establish a Registry for Alzheimer’s Disease; CERAD TS, Total Score of CERAD neuropsychological assessment battery; Aβ, amyloid-beta; AD-CM, AD-signature region glucose metabolism; AD-CT, AD-signature region cortical thickness; pIQ, premorbid Intelligence Quotient; LCA, lifetime cognitive activity; OC, occupational complexity; APOE ε4, apolipoprotein E ε4.
