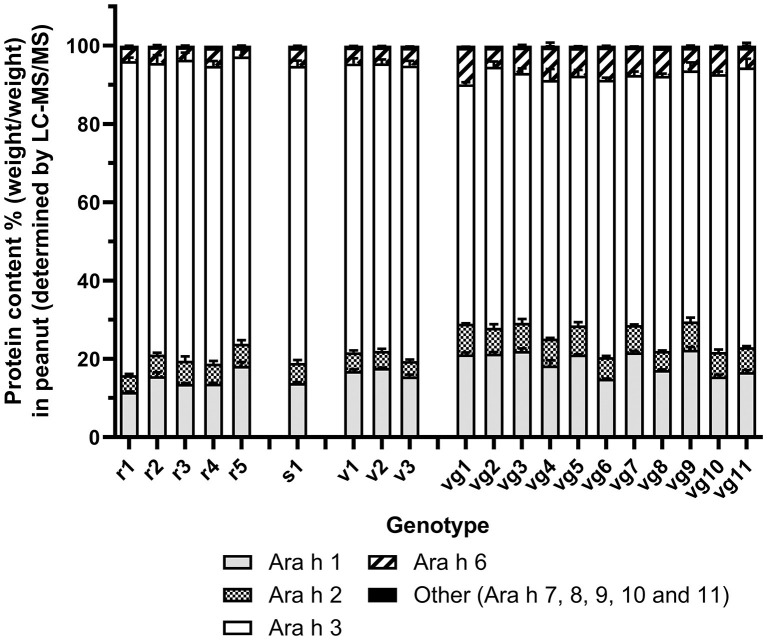
Figure 1.
Protein quantitation of Ara h 1, 2, 3, 6, and other (Ara h 7–11) as determined by shared peptide quantitation. Trypsin-digested protein spiked with glycogen phosphorylase peptides was analyzed by LC-MS/MS. Allergens were quantified by the shared peptides (Supplementary Table S5A) and normalized to glycogen phosphorylase. Stacked bar histogram plots show the mean protein content % [weight (allergen)/weight (total allergen)] in peanut for each allergen family and standard error of the mean (bar) from two biological replicates, which had two technical replicates for each sample (left y-axis). Each peanut genotype analyzed is shown on the x-axis.

