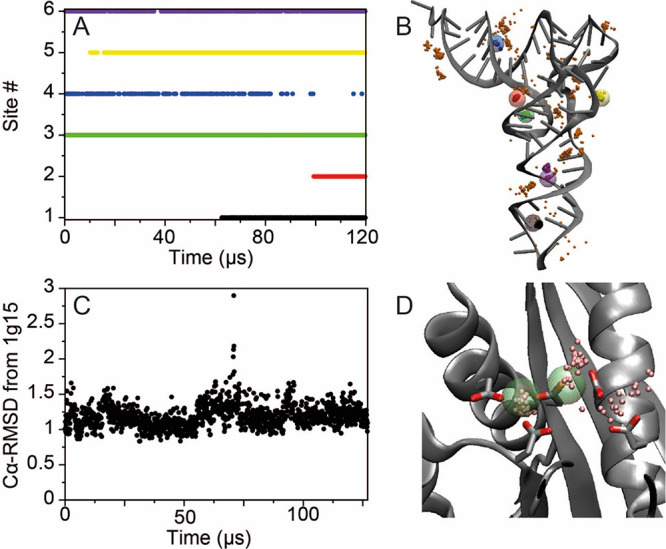
Figure 1.

Binding of Mg2+ to tRNA and RNaseH. (A) Occupancy of the six Mg2+ sites in tRNA as a function of simulation time. After 120 μs of simulation, five of the binding sites observed experimentally87 were occupied. (B) Mg2+ ion positions between 100 and 120 μs of simulation; 25 snapshots of the positions of the Mg2+ ions occupying the six binding sites are reported as small solid pink spheres. The positions of the crystallographic Mg2+ ions are highlighted as large transparent multicolored spheres. (C) Cα-RMSD in Å from the X-ray structure (PDB entry 1g15)92 in a 127 μs simulation of RNaseH started from the apo enzyme. (D) Snapshots of the positions of the Mg2+ ions from the last 20 μs of simulation (small pink spheres). The positions of the crystallographic Mn2+ ions are reported as large green transparent spheres.
