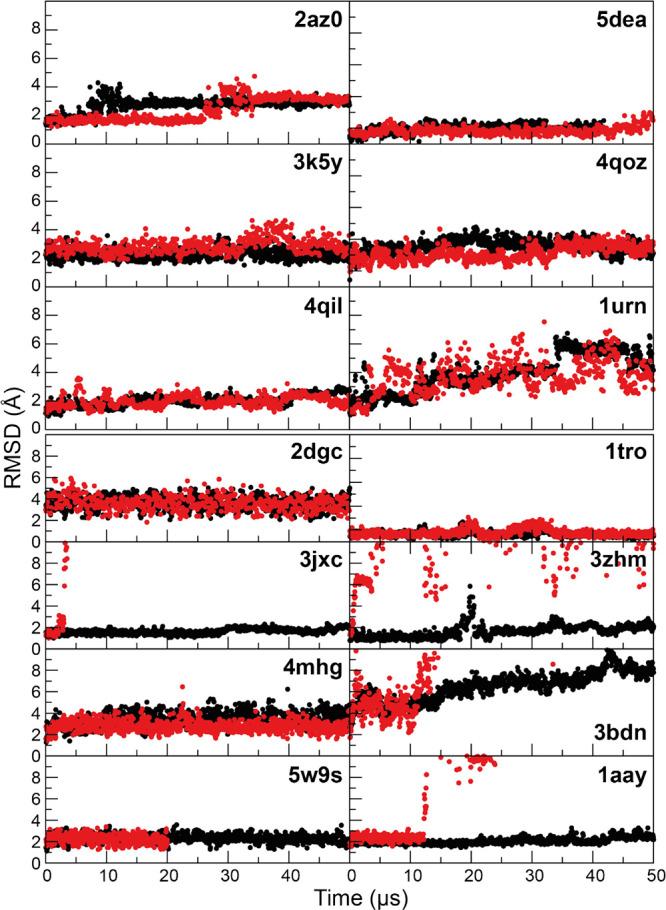
Figure 10.

MD simulations of six protein–RNA complexes (top) and eight protein–DNA complexes (bottom) performed with the DES-Amber 3.20 (black) and DES-Amber (red). Backbone RMSD traces are reported as a function of simulation time. Flexible terminal residues and regions that were not resolved in the X-ray structures were omitted from the RMSD calculations. Each panel is labeled with the PDB entry of the starting structure.
