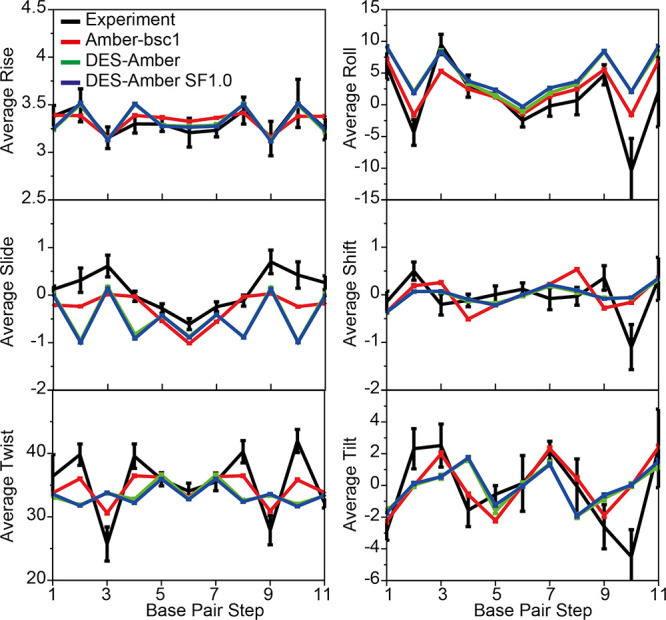
Figure 6.

MD simulations of DDD. Comparison of the average six base-step parameters (twist, roll, slide, rise, shift, and tilt) measured in simulations performed with DES-Amber (green), DES-Amber SF1.0 (blue), and Amber-bsc1 (red) to the values observed in seven crystal and NMR structures deposited in the protein data bank (PDB entries 1bna, 2bna, 7bna, 9bna, 1naj, 1jgr, and 4c64)101 (black). Error bars for the experimental values report the variance of the data. Error bars for the simulated data are estimated using block averaging of the trajectory data.
