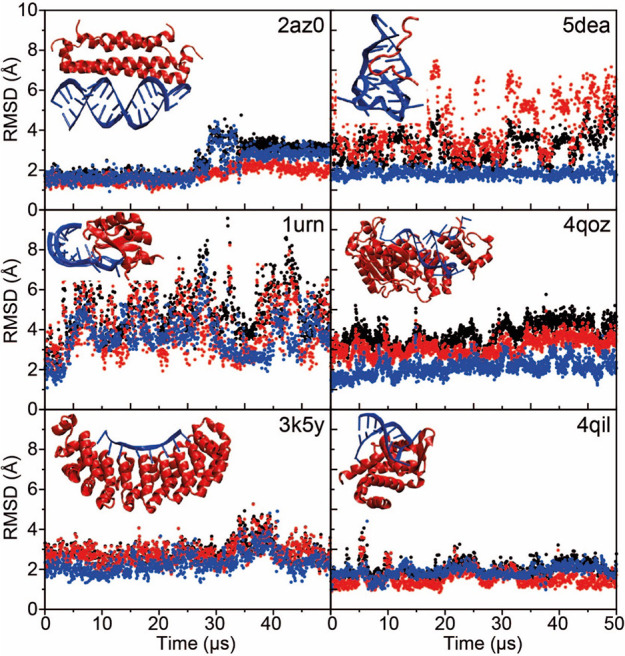
Figure 9.

MD simulations of six protein–RNA complexes performed with the DES-Amber force field. RMSD trace as a function of simulation time for the complex (black), the protein (red), and the RNA (blue). Each panel is labeled with the PDB entry of the starting structure. The experimentally determined structure of the complex is displayed as an inset in each plot.
