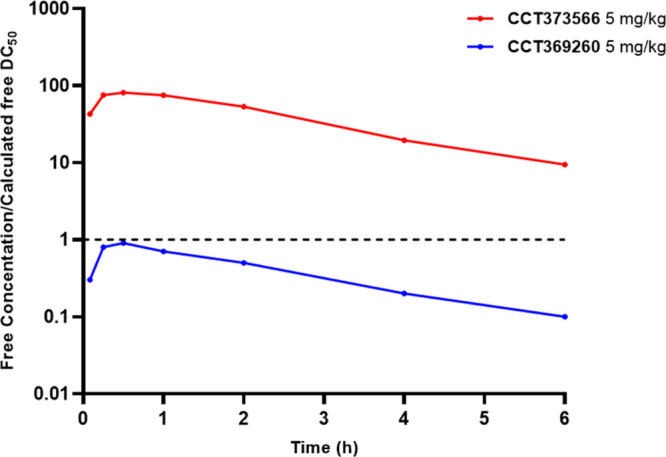
Figure 2.

Free mean mouse blood concentrations (nM) divided by the respective calculated free DC50 values (nM) of CCT373566 (red) and CCT369260 (blue) after po dosing at 5 mg/kg. The dashed, black line represents when a compound is at the free concentration equal to its free DC50 value.
