. 2021 Oct 28;81(24):6259–6272. doi: 10.1158/0008-5472.CAN-21-1256

Figure 3.

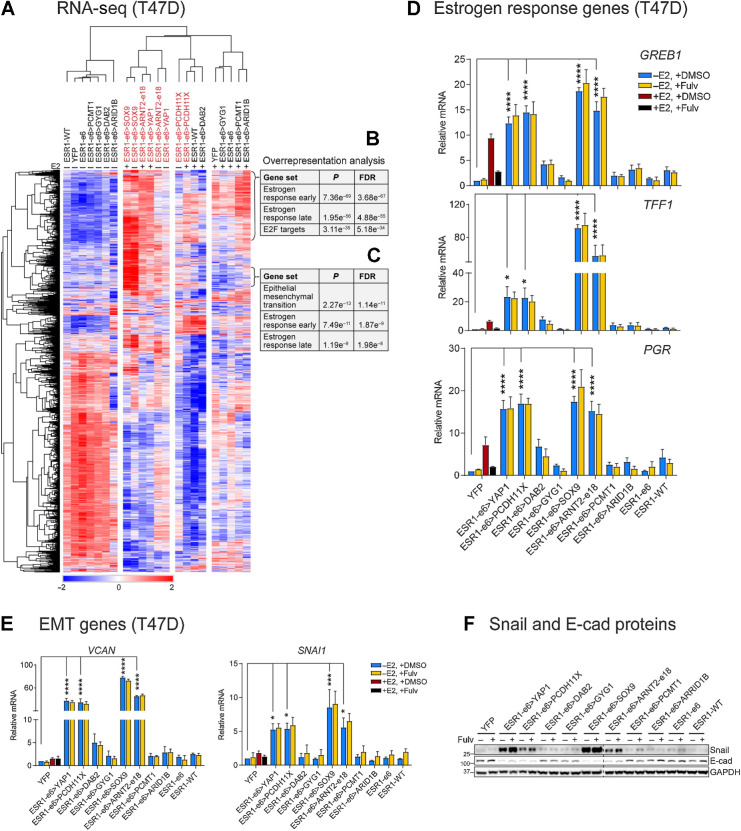
Figure 3. Active ESR1 fusion proteins upregulate expression of estrogen response and EMT genes. A, Heatmap showing the differently expressed genes in the T47D RNA-seq data. B and C, Active ESR1 fusions upregulate expression of two clusters of estrogen response (early and late) and EMT-related genes as indicated. D and E, Expression of estrogen response genes (GREB1, TFF1, and PGR) and EMT-related genes (VCAN and SNAI1) was measured by RT-qPCR in E2-deprived T47D cells treated with vehicle (+DMSO) or 100 nmol/L fulvestrant (+Fulv) in the absence (–E2) or presence (+E2) of 10 nmol/L E2 for 48 hours. Values were normalized to GAPDH mRNA, and relative expression was calculated as fold change to YFP, –E2 (mean ± SEM; n = 3). One-way ANOVA followed by Dunnett multiple comparisons test was used to compare each E2-deprived T47D cell line with YFP control cells (*, P < 0.05; ***, P < 0.001; ****, P < 0.0001). Two-way ANOVA followed by Bonferroni test was used for multiple comparisons for each stable cell after 100 nmol/L fulvestrant treatment. F, Snail and E-cadherin proteins were measured by immunoblotting in E2-deprived cells treated with or without 100 nmol/L fulvestrant (Fulv). GAPDH protein served as a loading control. The dashed line indicates two separate blots that were conducted at the same time. The representative image is from three independent experiments.

Active ESR1 fusion proteins upregulate expression of estrogen response and EMT genes. A, Heatmap showing the differently expressed genes in the T47D RNA-seq data. B and C, Active ESR1 fusions upregulate expression of two clusters of estrogen response (early and late) and EMT-related genes as indicated. D and E, Expression of estrogen response genes (GREB1, TFF1, and PGR) and EMT-related genes (VCAN and SNAI1) was measured by RT-qPCR in E2-deprived T47D cells treated with vehicle (+DMSO) or 100 nmol/L fulvestrant (+Fulv) in the absence (–E2) or presence (+E2) of 10 nmol/L E2 for 48 hours. Values were normalized to GAPDH mRNA, and relative expression was calculated as fold change to YFP, –E2 (mean ± SEM; n = 3). One-way ANOVA followed by Dunnett multiple comparisons test was used to compare each E2-deprived T47D cell line with YFP control cells (*, P < 0.05; ***, P < 0.001; ****, P < 0.0001). Two-way ANOVA followed by Bonferroni test was used for multiple comparisons for each stable cell after 100 nmol/L fulvestrant treatment. F, Snail and E-cadherin proteins were measured by immunoblotting in E2-deprived cells treated with or without 100 nmol/L fulvestrant (Fulv). GAPDH protein served as a loading control. The dashed line indicates two separate blots that were conducted at the same time. The representative image is from three independent experiments.