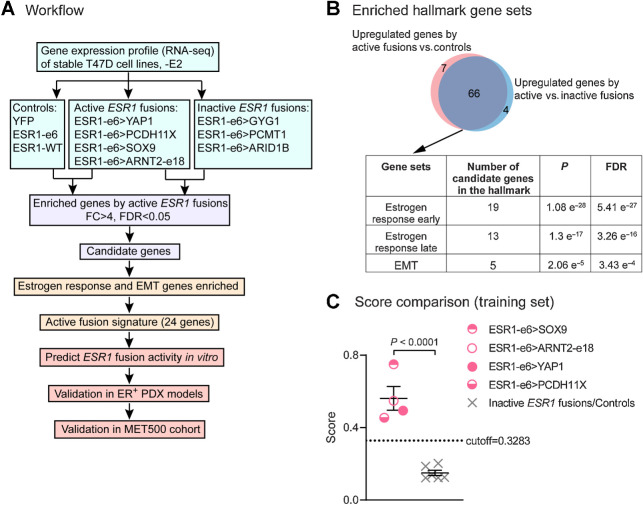
Figure 4.
Active ESR1 fusions program a unique, 24-gene transcriptional signature. A, Workflow to identify the gene signature to predict active fusions. FC, fold change; FDR, false discovery rate. B, Venn diagram showing overlapping upregulated genes by active ESR1 fusions compared with inactive fusions or control cells. The table below shows the top three Hallmark gene sets enriched in the candidate genes. C, Scatter plot showing signature scores of active ESR1 fusions (ESR1-e6>YAP1, ESR1-e6>PCDH11X, ESR1-e6>SOX9, and ESR1-e6>ARNT2-e18) compared with inactive fusions (ESR1-e6>GYG1, ESR1-e6>PCMT1, and ESR1-e6>ARID1B) and control cells (YFP, ESR1-e6, and ESR1-WT) all minus E2. A two-tailed t test was used to calculate statistical significance.

