. 2021 Oct 28;81(24):6259–6272. doi: 10.1158/0008-5472.CAN-21-1256

Figure 5.

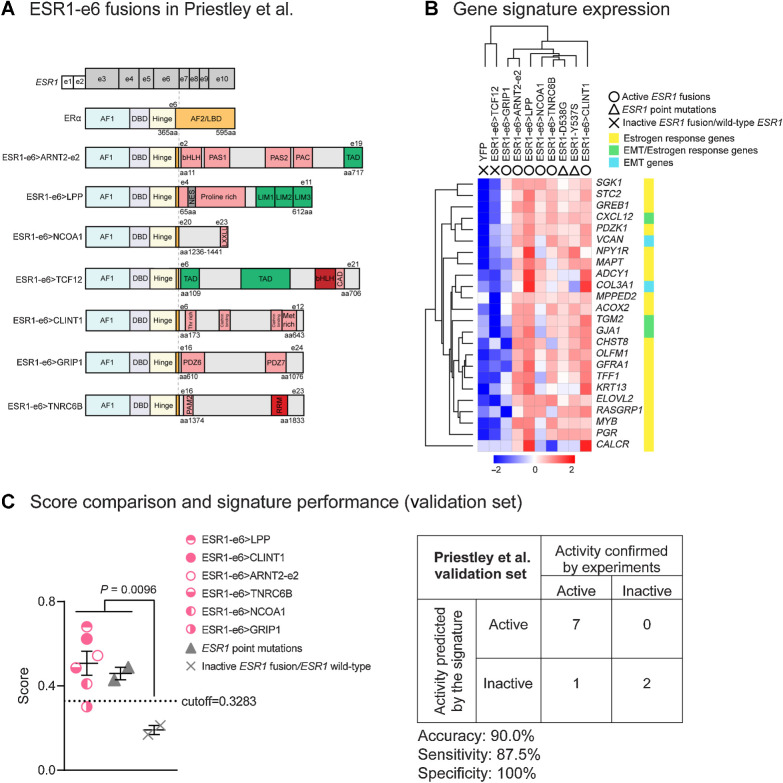
Figure 5. The MOTERA signature predicts activity of additional ESR1 fusions identified in ER+ MBC patients. A, Seven additional ESR1-e6 fusions identified in Priestley et al. (27) are illustrated. These in-frame fusions possess a common structure as shown in Fig. 1B. Pink boxes represent protein–protein interactions, including the Per-Arnt-Sim (PAS) domain, PAC motif, LXXLL motif, class A specific domain (CAD), threonine-rich domain (Thr rich), methionine-rich domain (Met rich), PDZ domain, and PABPC1-interacting motif-2 (PAM2). Green boxes either represent transcriptional activation domains (TAD) or LIM zinc-binding (LIM) domains that provide coactivator function for LPP. The gray box represents a nuclear export signal (NES) in LPP. Red boxes represent the bHLH DNA binding domain and the RNA recognition motif (RRM). B, Heatmap showing the expression of the 24-gene signature in T47D cells expressing additional ESR1 fusions and LBD point mutations (Y537S and D538G). Scale bar indicates row Z scores. C, Left, scatter plot showing signature scores of ESR1 mutations (including fusions and LBD point mutations) and YFP control cells expressing endogenous ERα. Two-tailed t test was used to compare scores. The ESR1–GRIP1 fusion was the only active fusion that did not reach score significance. Right, confusion matrix to measure the performance of the signature to predict the activities of ESR1 fusions. Accuracy is the proportion of correctly predicted events in all cases. Sensitivity is the ability of the signature to predict an active fusion event to be active. Specificity is the ability of the signature to predict an inactive fusion event to be inactive.

The MOTERA signature predicts activity of additional ESR1 fusions identified in ER+ MBC patients. A, Seven additional ESR1-e6 fusions identified in Priestley et al. (27) are illustrated. These in-frame fusions possess a common structure as shown in Fig. 1B. Pink boxes represent protein–protein interactions, including the Per-Arnt-Sim (PAS) domain, PAC motif, LXXLL motif, class A specific domain (CAD), threonine-rich domain (Thr rich), methionine-rich domain (Met rich), PDZ domain, and PABPC1-interacting motif-2 (PAM2). Green boxes either represent transcriptional activation domains (TAD) or LIM zinc-binding (LIM) domains that provide coactivator function for LPP. The gray box represents a nuclear export signal (NES) in LPP. Red boxes represent the bHLH DNA binding domain and the RNA recognition motif (RRM). B, Heatmap showing the expression of the 24-gene signature in T47D cells expressing additional ESR1 fusions and LBD point mutations (Y537S and D538G). Scale bar indicates row Z scores. C, Left, scatter plot showing signature scores of ESR1 mutations (including fusions and LBD point mutations) and YFP control cells expressing endogenous ERα. Two-tailed t test was used to compare scores. The ESR1–GRIP1 fusion was the only active fusion that did not reach score significance. Right, confusion matrix to measure the performance of the signature to predict the activities of ESR1 fusions. Accuracy is the proportion of correctly predicted events in all cases. Sensitivity is the ability of the signature to predict an active fusion event to be active. Specificity is the ability of the signature to predict an inactive fusion event to be inactive.