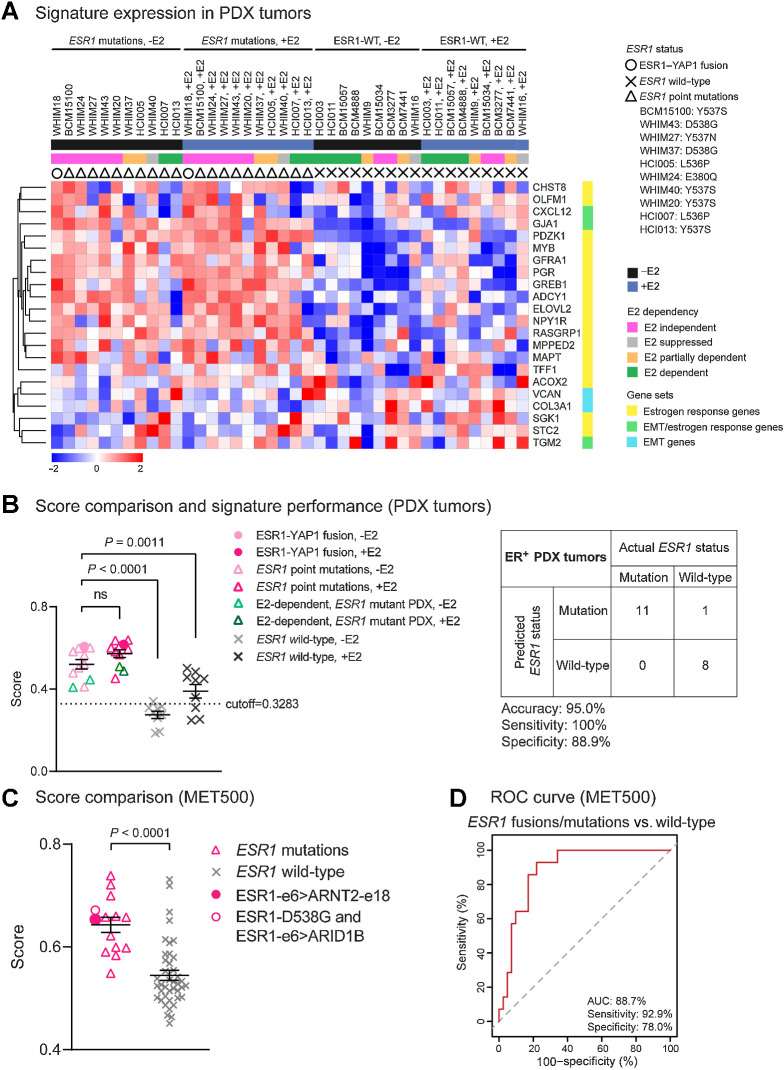
Figure 7.
The MOTERA signature predicts activity of ESR1 fusions/point mutations in ER+ PDX tumors and in MBC patients. A, Heatmap showing the expression of the 24-gene signature in 20 ER+ PDX tumors. Scale bar indicates row Z scores. CALCR and KRT13 in the signature were missing in the PDX RNA-seq data, so they were not included in the heatmap. B, Left, scatter plot showing mean signature scores of ESR1 mutations (including the ESR1–YAP1 fusion and LBD point mutations) and ESR1-WT expressing tumors. One-way ANOVA with Dunnett multiple comparisons test was used to calculate statistical significance. Right, confusion matrix to measure the performance of the signature to predict the presence of ESR1 mutations. Accuracy is the proportion of correctly predicted events in all cases. Sensitivity is the ability of the signature to predict an ESR1 mutation to be a mutant. Specificity is the ability of the signature to predict an ESR1-WT to be wild-type. C, Scatter plot showing mean signature scores of MBC patient tumors expressing ESR1 mutations versus ESR1-WT in the MET500 cohort (9). Two-tailed t test was used to compare scores. D, ROC curve for the 24-gene signature performance to differentiate ESR1 mutations from ESR1-WT in the MET500 cohort. The AUC is the probability that the signature ranks a randomly chosen ESR1 mutation higher than a randomly chosen WT ESR1 (100% is the best test, and the dashed diagonal line illustrates the performance of a random signature).

