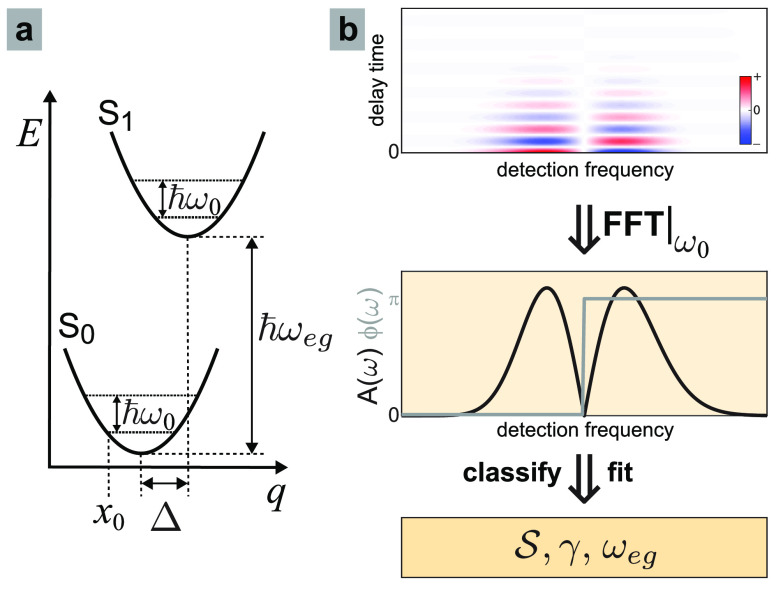
Figure 1.
(a) Displaced harmonic oscillator model of molecular
spectroscopy
is characterized by vibrational frequency (ω0), Huang–Rhys
factor ( ), and electronic energy shift (ℏωeg). (b) Measured vibrational quantum beat
signals (top) can be Fourier transformed to produce femtosecond coherence
spectra (FCS) for each mode (middle), which can then be classified
as a fundamental, overtone, or combination-band mode and then fit
using the appropriate model. (bottom) The fit yields the parameters
  and ωeg, as well as the electronic dephasing (γ).

