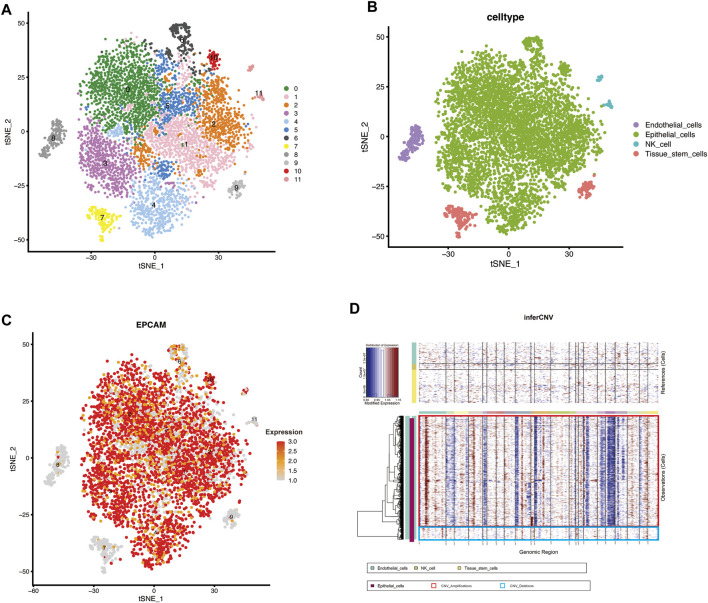
FIGURE 1.
scRNA-seq identified the cellular components in MIBC and inferred malignant epithelial cells (A,B) t-SNE plot showing clustering information in MIBC (C) FeaturePlot was used to demonstrate the identity of epithelial cells through the expression of a well-known specific marker (EPCAM) (D) Heatmap showing the chromosomal landscape of inferred large-scale copy number variations (inferCNVs) distinguishing individual tumor (malignant) cells from nontumor cells. Red box: Amplifications of CNV, Blue box: Deletions of CNV.

