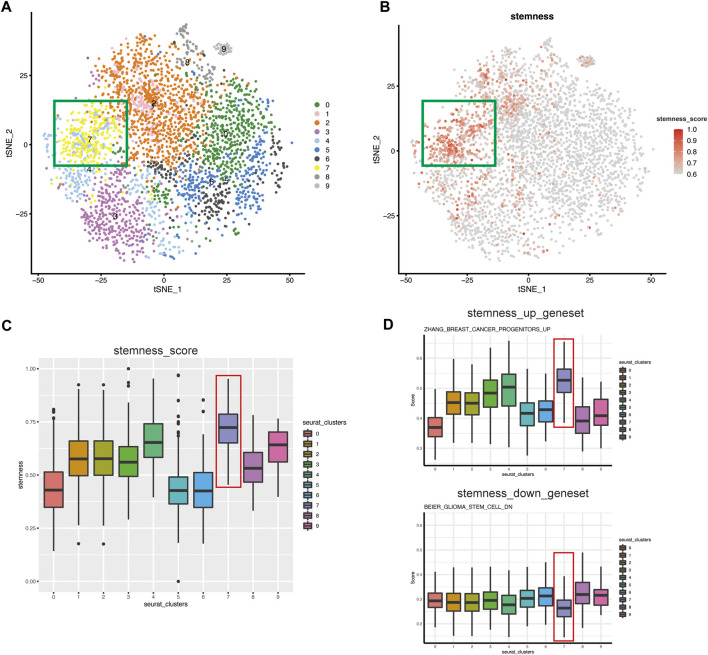
FIGURE 2.
The CSC subgroup was identified and verified by evaluation of stemness (A) t-SNE plot of malignant epithelial cells isolated across all specimens, colored and labeled by cluster. The cells of clusters-7 in the green box have higher stemness (B) t-SNE plot showing the stemness score for each cell. The color of the dots represents the stemness, and the darker the color, the higher the stemness. The cells in the green box have the highest stemness (C) Box plot showing the stemness score for each cluster. Cluster-7 has the highest stemness (D) ssGSEA score of CSCs-related gene set in each seurat_clusters. Top: Represent the gene set of stem genes upregulation. Bottom: Represent the gene set of stem genes downregulation.

