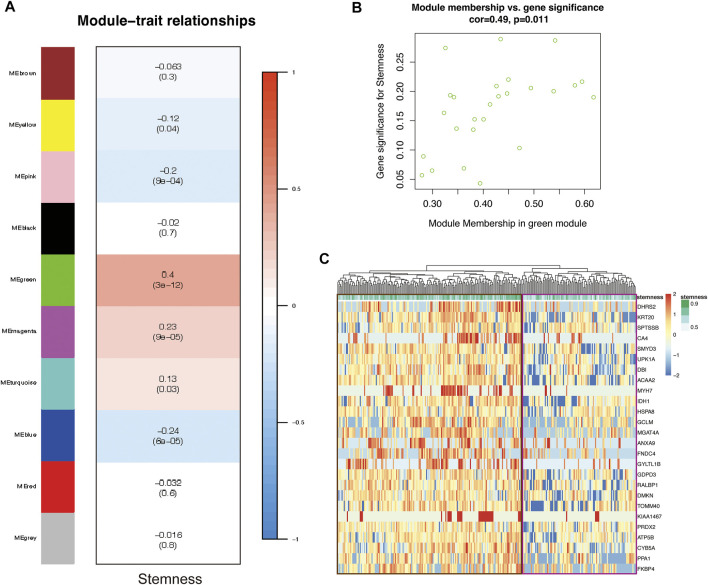
FIGURE 3.
The CSC gene-network module was identified by WGCN A. (A) Heatmap showing module associations. Each row corresponds to a module eigengene; each column, to stemness. In addition, each box contains the corresponding correlation and p-value (B) Scatter plot of gene significance (GS) for CSCs vs. module membership (MM) in the MEgreen module. There is a significant correlation between CSCs and the MEgreen module (C) Heatmap showing the relationship between 26 genes in the MEgreen module and stemness (cells with higher stemness are in the brown box; cells with lower stemness are in the purple box).

